# Art of Things
Created by Doortje Theunissen (dt222gv).
In this project sensor measurements are converted into [generative art](https://en.wikipedia.org/wiki/Generative_art).
Setting up an exact copy of this project will take approximately 2 to 4 hours, depending on how much software you still need to install.
## Objective
The objective of this project is to convert sensor output into artworks. In this first iteration, measurements of the temperature in my living room are collected. The summary statistics of a day's worth ('yesterday') of these measurements are then used to create a dataset containing 395k data points in a polar coordinate system. These points are plotted in a color that depends on the maximum temperature that was measured. This dataset and plot will only be made/exist when I visit a specific dashboard. If I don't visit it today, yesterday's data will never be turned into an artwork. It's important to note that I discovered polar coordinate art thanks to the [generativeart](https://github.com/cutterkom/generativeart) R library.
With this project, I wanted to give myself the chance to learn about IoT. I chose to do an art project (instead of a more serviceable project) to work on both my problem solving and creative skills. Since I'd never worked on generative art before, this project gave me to opportunity to explore this very interesting art style.
## Material
The materials I have used for this project are listed in the table below. I bought all of them (except for the USB wall plug that I had laying around) in a bundle together with some other items on the Electrokit website for 949 SEK. The second column of the table provides links to the items in several webshops, to give an idea how much they would cost if you buy them separately.
|Hardware|Price estimate|
|--------|--------------|
|LoPy4|[388 SEK](https://www.digikey.se/product-detail/en/pycom-ltd/LOPY4/1871-1019-ND/7917210)|
|Pycom expansion board|[176 SEK](https://www.digikey.se/product-detail/en/pycom-ltd/UNIVERSAL-EXPANSION-BOARD/1871-1004-ND/7721842)|
|Temperature sensor MCP9700|[8 SEK](https://www.electrokit.com/produkt/mcp9700-e-to-to-92-temperaturgivare/)|
|Micro USB cable|[15 SEK](https://www.biltema.se/kontor---teknik/datortillbehor/datorkablar/usb-micro/usb-20-a---micro-2000033376?gclid=Cj0KCQjw6ZOIBhDdARIsAMf8YyH6UvUNBAMAS8xHMC6EsQ9NlqyZ2Q3Dyx_Q6OZ_b-2FmYG1gkoxHW4aAuOREALw_wcB)|
|Breadboard|[42 SEK](https://www.digikey.se/product-detail/en/bud-industries/BB-32621/377-2094-ND/4156445)|
|Jumper wire|[46 SEK](https://www.digikey.se/product-detail/en/bud-industries/BC-32670/377-2262-ND/5291564)|
|USB wall plug|[75 SEK](https://cdon.se/hemelektronik/vaggladdare-1-x-usb-a-port-1a-slim-vit-goobay-44948-p50639157)|
|*Total*|*750 SEK*|
### LoPy4 + Pycom expansion board
The LoPy4 is a mini computer that can run micropython programs. It runs right out of the box and has the possibility to be connected over Wifi, Bluetooth, LoRa and Sigfox.
The LoPy4 can be 'clicked' onto the expansion board, which gives the option to connect it to a computer or power source using a micro USB cable. It also gives the option to connect sensors without having to solder them to the LoPy4.
### Temperature sensor MCP9700
The MCP9700 is an analog temperature sensor whose output voltage is directly proportional to measured temperature. It can measure temperatures from -40°C to +150°C. The datasheet with all its details can be downloaded [here](https://www.microchip.com/en-us/product/MCP9700#).
### Other items
The cable, wires, plug and breadboard are used to connect the different parts with eachother and with a power source. A more detailed description of the setup will follow later.
Since the breadboard is quite big, it might be nice to use a smaller one, such as the [mini solderless breadboard from Adafruit](https://www.adafruit.com/product/2463).
## Computer setup
I have used a MacBook Air (M1, 2020) which runs macOS Big Sur during this project.
It is recommended to flash the firmware of your board before you start with programming your LoPy4 to do anything. However, I had some problems flashing my device, apparently (according to Google) due to having an M1 chip in my laptop. Luckily, I didn't experience any problems due to not flashing it. If you do want to give it a shot, [here is a tutorial](https://docs.pycom.io/updatefirmware/device/).
### Atom
To connect the LoPy4 to my computer and to upload code onto it (and test the code beforehand) I've used Atom, which can be downloaded [here](https://atom.io). Connection to the LoPy4 is made easy by using the [Pymakr plugin](https://atom.io/packages/pymakr).
After installing both Atom and Pymakr, you can simply connect your device with a USB cable to your computer and Pymakr will connect it automatically.
You can then write your code in Atom, test it by clicking a single button, and upload it by clicking another single button.
Instructions generally say that you need to install Node.js to get Pymakr to work. But before I knew that I got an error message saying that I needed to install Xcode (you can download it on the App Store) and than everything just worked perfectly (Maybe it includes Node.js, I haven't looked into it).
The reason I've decided to work with Atom, and Pymakr, is because I've used Atom before and because Atom is one of the popular choices when it comes to working with Pycom products.
### RStudio
The frontend part of my project required some R code to be uploaded to my platform of choice (more info on this later). For that part I've chosen to work with RStudio. Instructions to install it can be found [here](https://www.rstudio.com/products/rstudio/download/#download).
The R language is perfect for data visualisation and has specialized libraries to create dashboards. It is perfect for experimenting with generative art. Uploading code from RStudio also just required me to press a single button.
## Putting everything together
Follow these steps to put everything together (scroll down if you need visuals):
- Click the LoPy4 onto the expansion board. The LED of your LoPy4 should be on the same side as your USB cable connection on the expansion board.
- Connect the temperature sensor to the breadboard, close to the middle, with the flat side pointing to the outside of the breadboard (mine is in column f and rows 19-20-21).
- Connect the left side of the sensor (row 21 for me) to the 3v3 on the expansion board. You can either do this with a single wire, or you can connect it to the positive row on the breadboard first and then to the expansion board with a second wire. Using two steps makes it easier to connect a second sensor later on if you want.
- Connect the right side of the sensor (row 19 for me) with GND on the expansion board. Either connect it straight away or via the negative row on the breadboard.
- Connect this middle of the sensor (row 20 for me) to P16 (There are other options as well, but my code uses P16).
- Connect the microUSB cable to the expansion board. Now you can connect it to your computer to upload code and later on to a power source to run the code without needing your computer.
The images below shows what my setup looks like:

The next image gives a clean overview of which wires should be connected to what.

As I mentioned before I'm using a USB plug for power provision. It is possible to use a battery pack instead, but since I'm taking measurements in my living room, I just used the wall outlet. Because of this I didn't really have to take power use efficiency into account when writing my code. As a result I have a constant power usage, no deep sleep in between.
According to the [Pycom documentation](https://docs.pycom.io/gitbook/assets/specsheets/Pycom_002_Specsheets_LoPy4_v2.pdf) the average power consumption is 107 mA when connected to WiFi. This means I can calculate the energy consumption as follows: 0.107A x 5V = 0.535 Wh. (Nothing in comparison to our clothes dryer 🙃).
## Platform
I've chosen to work with the cloud platforms [Ubidots](https://ubidots.com) and shinyapps.io. Both platforms have a free tier and are easy to use.
### Ubidots
Ubidots is the platform that collects the sensor data from my LoPy4. There are several platforms you can choose from, but this one has everything my project needs:
- It's not too difficult to send data to Ubidots over Wi-Fi (Pybytes may be easier, but misses other functionality).
- The free tier includes three devices, which is more than the 1 free device I needed.
- The free tier includes if-then triggers (more info on the trigger I selected later).
- The API makes it very easy to get data out of Ubidots as well.
How to set it up:
- Create a Ubidots STEM account on [Ubidots](https://ubidots.com).
- Follow [this very awesome tutorial](https://help.ubidots.com/en/articles/961994-connect-any-pycom-board-to-ubidots-using-wi-fi-over-http) on how to send data to Ubidots, it's written by Maria Hernandez.
### shinyapps<i></i>.io
Shinyapps<i></i>.io is a platform that lets you host your own R Shiny apps. The free tier includes 5 applications with 25 active hours in total per month.
I've chosen this platform because Shiny is my favorite way of making dashboards. I've used several dashboard platforms before, such as Tableau or Looker, but they are just not the same. Shiny dashboards are built from code, so you can let them do anything you want.
How to set it up:
- Create an account on shinyapps.io.
- Look at the [tutorial](https://shiny.rstudio.com/articles/shinyapps.html) to learn how to upload Shiny dashboards.
- If you're interested in creating your own dashboard, you can find some information to get started [here](https://shiny.rstudio.com/tutorial/). Otherwise, feel free to just copy paste my code, shown in the next section (and just fill in a few things like your API key, see below).
## The code
All the code for this project can be found in [my github repository](https://github.com/doortjetheunissen/iot-course). There are two separate folders.
### Ubidots ###
The Ubidots folder contains the code that should be uploaded to the LoPy4. It's almost an exact copy of the code that is used in the [tutorial](https://help.ubidots.com/en/articles/961994-connect-any-pycom-board-to-ubidots-using-wi-fi-over-http) by Maria Hernandez that I mentioned before. I just changed a few things to send the temperature instead of the tutorial values, and maybe some other very small things as well.
For example, my code contains these lines to send the temperature:
```python=
DELAY = 900 # Delay in seconds
adc = machine.ADC()
apin = adc.channel(pin='P16')
while True:
millivolts = apin.voltage()
celsius = (millivolts - 500.0) / 10.0
post_var("pycom", celsius)
time.sleep(DELAY)
```
**! Make sure to fill in your Ubidots token on line 6 in main<i></i>.py (the one you used in Maria's tutorial) and your Wi-Fi credentials on line 16 in main<i></i>.py.**
### shinyapps<i></i>.io ###
The RShiny-Dashboard folder contains the files that need to be uploaded to shinyapps<i></i>.io. This can be done by creating a new project in RStudio (File>New Project) and putting the github files in your project folder.
The part of the code that creates the dataset and image is based on the [generativeart](https://github.com/cutterkom/generativeart) R library. Combining this with IoT and temperature statistics input is my own work.
The code snippet below (lines 82-94 in server.R) shows how the temperature statistics are used in creating the data points. The adjusted values are the result of me playing around with different graphic outcomes.
```R=
minimum_adjusted <- minimum / 10
maximum_adjusted <- maximum / 10
average_adjusted <- (average - 25) / 10
difference_adjusted <- (maximum_adjusted - minimum_adjusted - 0.5) * 2
my_formula <- list(
x = quote(average_adjusted * sign(x_i) * abs(x_i) ^ minimum_adjusted - sin(sign(y_i) * abs(y_i) ^ maximum_adjusted)),
y = quote(difference_adjusted * sign(y_i) * abs(y_i) ^ minimum_adjusted + cos(sign(x_i) * abs(x_i) ^ maximum_adjusted))
)
df <- seq(from = -pi, to = pi, by = 0.01) %>%
expand.grid(x_i = ., y_i = .) %>%
mutate(!!!my_formula)
```
**! Make sure to fill in your Ubidots API key in api_key.R (this is the same key we called Ubidots token in the LoPy4 code) and your variable ID (see the explanation on lines 4-14 in server.R).**
If everything is filled in correctly you can publish by pushing the blue button (as explained in this [shinyapps tutorial](https://shiny.rstudio.com/articles/shinyapps.html)).
## Transmitting the data / connectivity
New data is sent to Ubidots every 15 minutes. I chose 15 minutes because it seemed like a decent interval, taking into account how fast the temperature in my living room changes. I didn't have to take into account the power consumption, since my LoPy4 is connected to a wall outlet (and to power usage is too small to have an effect on global warming).
The image below shows the placement in my living room.

I chose to work with WiFi, because the LoRa and Sigfox connections are not optimal where I live. Setting up a local LoRa network is outside of my budget at the moment.
The transport protocol that is being used is HTTP. It was already used in the tutorial I followed to learn how to set up a connection with Ubidots. And since my LoPy4 is not receiving any data and only sending 1 value every 15 minutes, there was no real advantage in using MQTT anyways.
## Presenting the data
The data used in this project is stored in Ubidots. With a Ubidots STEM account, the data is kept for 1 month. I didn't set up anything else to store my data for a longer time, because this project doesn't have a need for historical data.
I set 1 trigger in Ubidots to be sure my Lopy4 doesn't stop sending data for whatever reason. When Ubidots has not received any new data for an hour, it will send me an email. You can do this by going to Data>Events, from there on it is pretty self-explanatory.
The dashboard platform itself does not save any of the data. It just does an API call to collect the necessary data whenever it needs it to create an image.
Here you can see a view of the dashboard in my Safari browser.

## Finalizing the design
I'm happy with how my project turned out. It's the first time I've looked into both IoT and generative art. I was really surprised on how much there is to find on generative art.
I used some mock data on my project to see what the artworks can look like throughout the seasons. Here are some examples:
|||
|---------|-------|
|||
In the future, I might try other sensors and other generative art styles as well.
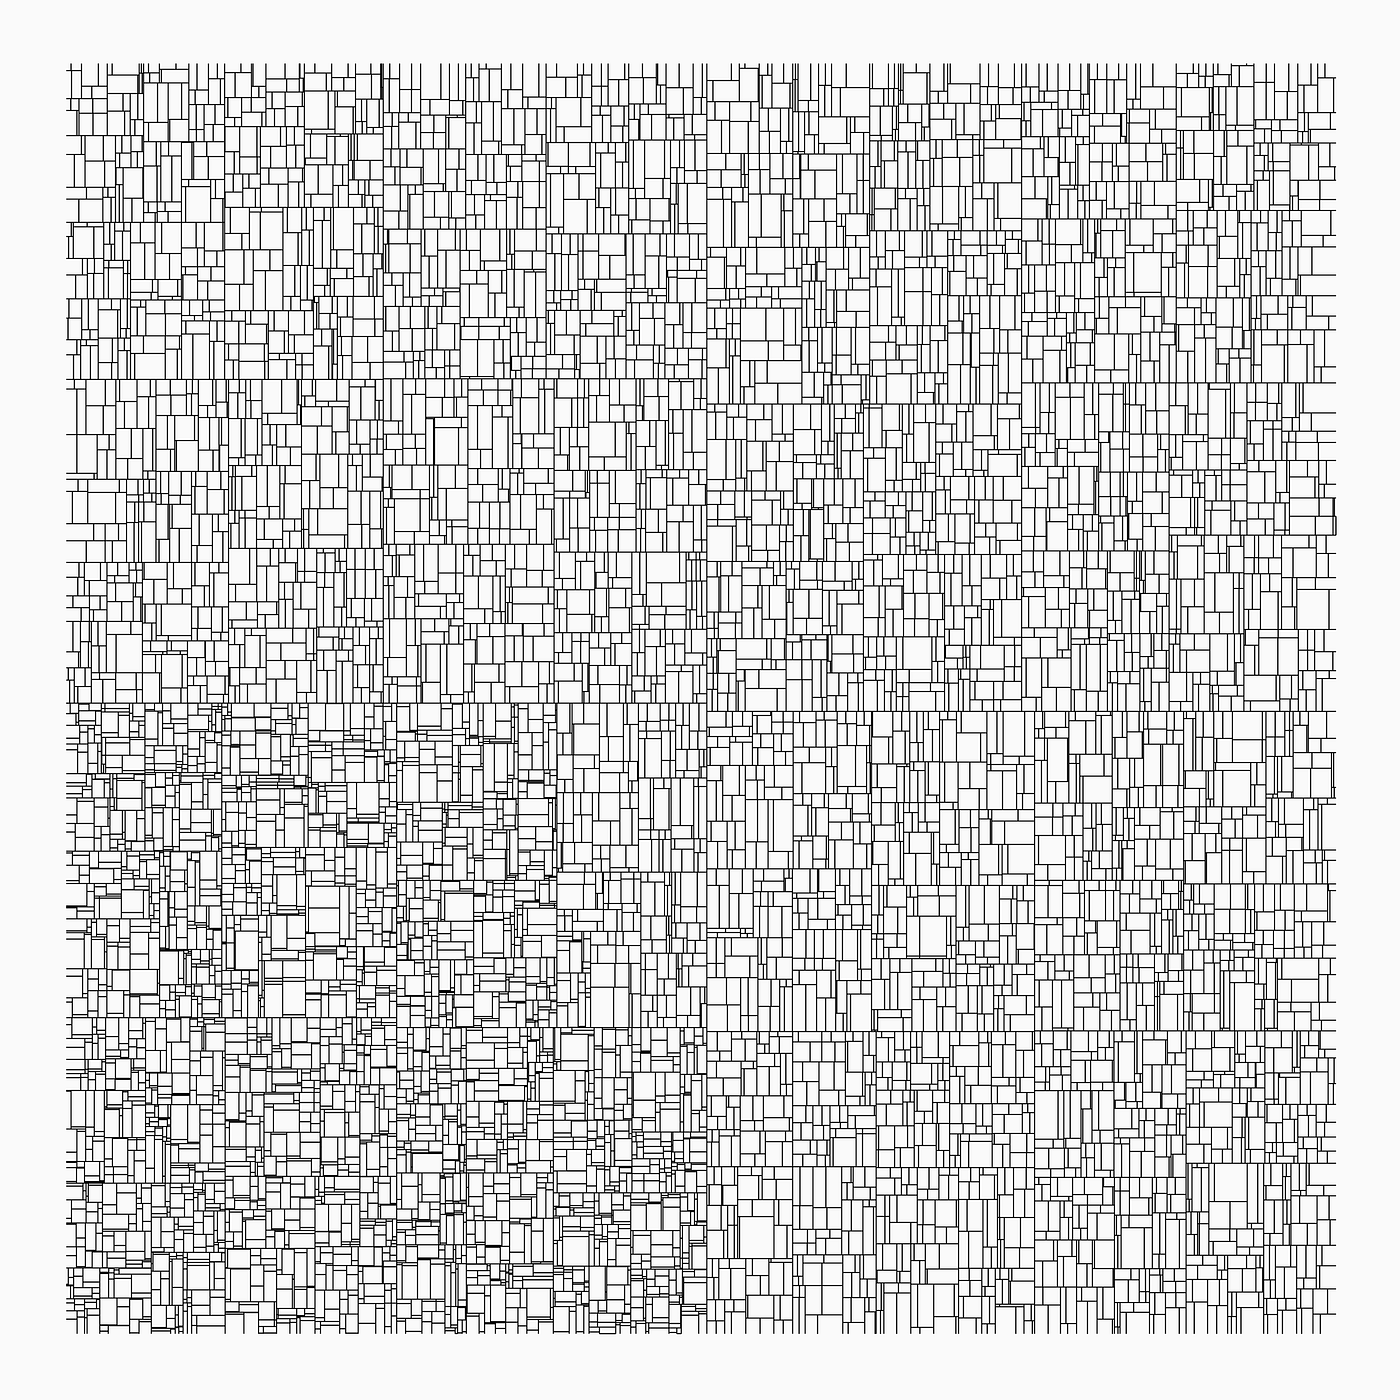
The [mathart library](https://github.com/marcusvolz/mathart) by Marcus Volz has some interesting options. I'm thinking of recoding his kdtree function (image below) to make art depending on how often I open the fridge or something like that.
Originally, I also wanted to use my dog in my project, but he's to small to safely carry a combination of the LoPy4, expansion board and battery pack around. Maybe one day I'll try something with smaller microcomputers, after I've tried soldering.
 Sign in with Wallet
Connect another wallet
Sign in with Wallet
Connect another wallet