# Random and sequential
contributed by <`krimson8`, `aben20807`, `allenchen8210`, `dange0`, `flawless0714`>
###### tags: `sysprog2018`
[**github**](https://github.com/dange0/random-access-on-cache)
:::info
本實驗由 [Memory part 2: CPU caches](https://lwn.net/Articles/252125/) 摘錄並實做討論。
:::
## 實驗說明
快取之所以有效,主要是因為程式運行時對記憶體的訪問呈現局部性(Locality)特徵。這種局部性既包括空間局部性(Spatial Locality),也包括時間局部性(Temporal Locality)。
因此本實驗將透過隨機存取來打破程式對記憶體存取的局部性,來凸顯局部性對快取機制的重要性。
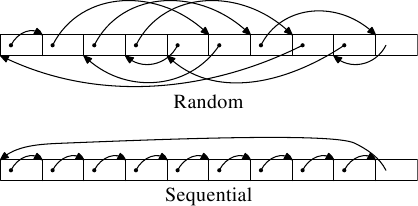
本實驗分為兩種測試類型,分別為順序存取(sequential access)與隨機存取(random access)。所有的元素都會被存在一個一維陣列,在順序存取的情境下會依序走訪陣列中的所有元素,而在隨機存取的情境下則會隨機存取陣列中的元素,如上圖所示。陣列會依序變大,以**比較不同大小的陣列在順序存取與隨機存取下對性能造成影響的差異**。
## 實驗環境
### CPU information
```
$ lscpu
Architecture: x86_64
CPU op-mode(s): 32-bit, 64-bit
Byte Order: Little Endian
CPU(s): 8
On-line CPU(s) list: 0-7
Thread(s) per core: 2
On-line CPU(s) list: 0-7
Thread(s) per core: 2
Core(s) per socket: 4
Socket(s): 1
NUMA node(s): 1
Vendor ID: GenuineIntel
CPU family: 6
Model: 158
Model name: Intel(R) Core(TM) i7-7700 CPU @ 3.60GHz
Stepping: 9
CPU MHz: 4040.296
CPU max MHz: 4200.0000
CPU min MHz: 800.0000
BogoMIPS: 7199.85
Virtualization: VT-x
L1d cache: 32K
L1i cache: 32K
L2 cache: 256K
L3 cache: 8192K
NUMA node0 CPU(s): 0-7
Flags: fpu vme de pse tsc msr pae mce cx8 apic sep mtrr pge mca cmov pat pse36 clflush dts acpi mmx fxsr sse sse2 ss ht tm pbe syscall nx pdpe1gb rdtscp lm constant_tsc art arch_perfmon pebs bts rep_good nopl xtopology nonstop_tsc aperfmperf pni pclmulqdq dtes64 monitor ds_cpl vmx smx est tm2 ssse3 sdbg fma cx16 xtpr pdcm pcid sse4_1 sse4_2 x2apic movbe popcnt tsc_deadline_timer aes xsave avx f16c rdrand lahf_lm abm 3dnowprefetch epb invpcid_single intel_pt ssbd ibrs ibpb stibp kaiser tpr_shadow vnmi flexpriority ept vpid fsgsbase tsc_adjust bmi1 hle avx2 smep bmi2 erms invpcid rtm mpx rdseed adx smap clflushopt xsaveopt xsavec xgetbv1 dtherm ida arat pln pts hwp hwp_notify hwp_act_window hwp_epp flush_l1d
```
### Cache line information
在 linux 中,cache 資訊被放在 ` /sys/devices/system/cpu/cpu0/cache/` 底下,該目錄底下又分為 index0, index1, index2, index3 四個目錄:
|目錄|index0|index1|index2|index3|
|-|-|-|-|-|
|cache 類型|L1d|L1i|L2|L3|
cache line 資訊放在 `coherency_line_size` 中,
```bash
$ cat /sys/devices/system/cpu/cpu0/cache/index0/coherency_line_size
64
```
n ways of associativity 的資訊放在 `ways_of_associativity` 中,
```bash
$ cat /sys/devices/system/cpu/cpu1/cache/index0/ways_of_associativity
8
```
## 實驗方法
### 環境設定
該實驗會大量消耗記憶體,因此必須先將限制 stack 大小之設定解除:
```bash
$ ulimit -s unlimited
```
L1, L2 cache 只有同一核心才共用,為了降低實驗誤差,因此以下實驗都會指定於單核進行
```bash
$ taskset --cpu-list 0 ./$(EXEC)
```
以上設定皆在 Makefile 內完成
#### random access
```cpp=
double random_access(unsigned int size)
{
char array[size];
int index[size], result, i;
result = 0;
for (i = 0; i < (int) size; i++) {
index[i] = rand() % size;
}
double t1 = tvgetf();
for (i = 0; i < size; i++) {
result += array[index[i]];
}
double t2 = tvgetf();
return (t2 - t1) / size;
}
```
在 random access 中,需要解決的是要如何避免 CPE 都耗費在選取 array 的 random index 上。因此我們事先將算出要走訪的 index 並將其存在名為 `index[]` 的 array 中,接著在正式計算 CPE 時只需要取出儲存在 `index[]` 中的預先隨機數做為要走訪的位置就好了,見第11行。
### sequencial access
```cpp=
double sequence_access(unsigned int size)
{
char array[size];
int index[size], result, i;
result = 0;
for (i = 0; i < size; i++) {
index[i] = i;
}
double t1 = tvgetf();
for (i = 0; i < size; i++) {
result += array[index[i]];
}
double t2 = tvgetf();
return (t2 - t1) / size;
}
```
為了拉近 random access 與 sequencial access 的 baseline 成本,我們一樣將具有順序的 index 也存進 array 中,在實際測量 CPE 時,一樣需要從 `index[]` 中取出要走訪的位置。
### 平均值
```cpp=
double avg_result(double (*func)(unsigned int), unsigned int size)
{
double result[20];
int i;
for (i = 0; i < 20; i++) {
result[i] = func(size);
}
qsort(result, 20, sizeof(double), compare);
double avg = 0;
for (i = 5; i < 15; i++) {
avg += result[i];
}
return avg / 10;
}
```
為了有效降低 `rand()` 產生出極端的數值分布與 context switch 造成的影響,每次做測試都會重複 20 次,並且取中間的 10 筆資料的平均值。
## 實驗結果
### 分析 sequential
下圖為 sequential read access 在不同 working set size 所造成的差異。

這張圖可以分為四部分討論,
- 2^0^ ~ 2^4^ bytes
- 基本上這邊大小的資料都可以在一個 cache line 中解決,因此都為 0 CPE
- 2^4^ ~ 2^6^ bytes
- 2^6^ bytes
- 該狀況比較特別,可以參見 [有趣的 cache line 效應](https://champyen.blogspot.com/2017/05/cache-line.html)
- 2^6^ bytes ~
上述實驗結果與 [Memory part 2: CPU caches](https://lwn.net/Articles/252125/) 中討論的 `Figure 3.10: Sequential Read Access, NPAD=0` 有所差異

在他們的實驗中,可以看到存取的 CPE 約可分成三個層級,分別是
* $小於2^{15}$ bytes.
* $2^{15} \sim 2^{20}$ bytes
* $大於2^{20}$ bytes
實驗是在64位元的環境下進行,因此可以解釋成
* L1d cache = $2^{14}$ bytes =16 kB
* L2 cache = $2^{20}$ bytes =1 MB
* 由於 Cache 並不會只裝了程式的資料,還會被系統的其他部分使用,因此在圖中層級與層級間並不會有突然的上升,而是漸進的上升。
另外看到上面提到的各階層存取 cycles

對照可以看到圖中 L1d 大約是 4 cycles,但 L2 卻只要 9 cycles,是因為使用了連續的儲存區域,因此會受到 processor `prefetch` 下一行 cache line 的影響。
:::info
此部分引用 [Cache 原理和實際影響](https://hackmd.io/s/HkyscQn2z) 之解析。
:::
### 比較 sequential 與 random
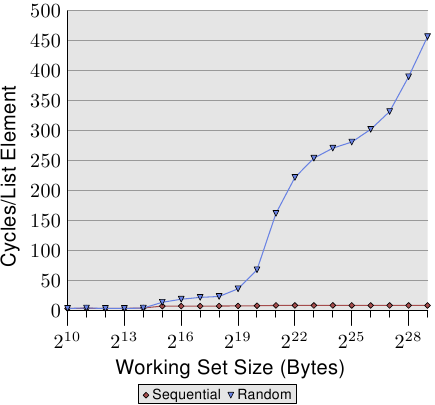
這張圖顯示了 sequential access 與 random access 在不同的 working set size 下 CPE 的差異,

由實驗結果明顯的看到隨機存取導致程式碼沒有局部性,進而造成 cache miss 的發生,因此他的 CPE 一路飆升。
對 sequential access 與 random access 來說, **2^15^** 是一個分水嶺,在 2^15^ 之後,random access 的 CPE 開始快速的成長,而 2^15 = 32K 剛好也是 L1d 的大小,因此這邊推斷**為 L1d cache 已經無法將所有資料放入**,因此導致先前 cache prefetch 進來的資料會被之後的 cache miss prefetch 給置換,再搭配 random access 的難以捉摸特性,使得 prefetch 進來的資料可能都還沒有用到就被置換,最終必須要再往更高級的 cache 要取資料。
上述實驗結果與 [Memory part 2: CPU caches](https://lwn.net/Articles/252125/) 中討論的 `Figure 3.15: Sequential vs Random Read, NPAD=0` 趨勢雷同。
## Software prefetch & hardware prefetch
此篇[文章](https://lwn.net/Articles/444336/)中提到, 在 list 中使用 software prefetch 的效能會比單一使用 hardware prefetch 的效能來的差, 即使 software prefetch 有排除掉預取空指標的問題(prefetch(NULL), 通常發生在 list 的尾巴, 平均會浪費20個 cpu cycles), 效能還是會比單一使用 hardware prefetch 來的低落. 此外, hardware prefetch 與 software prefetch 假如同時運作會有互相阻礙的情形, 進而導致更低落的效能.
## 參考資料
- [CPU cache - wiki](https://en.wikipedia.org/wiki/CPU_cache)
- [Cache 原理和實際影響](https://hackmd.io/s/HkyscQn2z)
- [The problem with prefetch](https://lwn.net/Articles/444336/)
 Sign in with Wallet
Connect another wallet
Sign in with Wallet
Connect another wallet