---
title: Virgil - Intro To Pandas Seaborn - S91 Merge and Concat
tags: Virgil, LearnWorld, IntroPandasSeaborn
---
<a target="_blank" href="https://colab.research.google.com/drive/1Zv6xsUq64hnm-DeWPVFuYW2FTdFmR8Rd"><img src="https://www.tensorflow.org/images/colab_logo_32px.png" />Run in Google Colab</a>
#**CONCATENATE & MERGE**
```python
import pandas as pd
```
#1. Concatenate
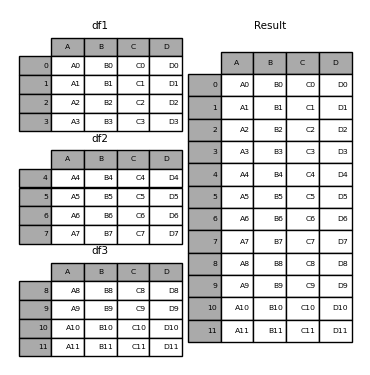
Concatenation is to connect multiple array together along a certain axis. In the context of Pandas, to concatenate is to connect 2 or many dataframes on the column-wise, or row-wise.
*It is similar to UNION in SQL.*
In the below example, df1-2-3 are concatenated on the column-wise to create the result dataframe.
Implementation in code
```python
# Define the dataframes
df1 = pd.DataFrame({"A": ["A0", "A1", "A2", "A3"],
"B": ["B0", "B1", "B2", "B3"],
"C": ["C0", "C1", "C2", "C3"],
"D": ["D0", "D1", "D2", "D3"]},
index=[0, 1, 2, 3])
df2 = pd.DataFrame({"A": ["A4", "A5", "A6", "A7"],
"B": ["B4", "B5", "B6", "B7"],
"C": ["C4", "C5", "C6", "C7"],
"D": ["D4", "D5", "D6", "D7"]},
index=[4, 5, 6, 7])
df3 = pd.DataFrame({"A": ["A8", "A9", "A10", "A11"],
"B": ["B8", "B9", "B10", "B11"],
"C": ["C8", "C9", "C10", "C11"],
"D": ["D8", "D9", "D10", "D11"]},
index=[8, 9, 10, 11])
```
The concatenation can be done by simply call `pd.concat()`. The syntax requires 2 parameters:
- A list of dataframes to be concatenated
- The axis to perform: 0 means column, 1 means row.
```python
# Dont forget to put the tables in a list
# axis = 0 by default --- concat by columns
pd.concat([df1, df2, df3], axis=0)
```
<div>
<style scoped>
.dataframe tbody tr th:only-of-type {
vertical-align: middle;
}
.dataframe tbody tr th {
vertical-align: top;
}
.dataframe thead th {
text-align: right;
}
</style>
<table border="1" class="dataframe">
<thead>
<tr style="text-align: right;">
<th></th>
<th>A</th>
<th>B</th>
<th>C</th>
<th>D</th>
</tr>
</thead>
<tbody>
<tr>
<th>0</th>
<td>A0</td>
<td>B0</td>
<td>C0</td>
<td>D0</td>
</tr>
<tr>
<th>1</th>
<td>A1</td>
<td>B1</td>
<td>C1</td>
<td>D1</td>
</tr>
<tr>
<th>2</th>
<td>A2</td>
<td>B2</td>
<td>C2</td>
<td>D2</td>
</tr>
<tr>
<th>3</th>
<td>A3</td>
<td>B3</td>
<td>C3</td>
<td>D3</td>
</tr>
<tr>
<th>4</th>
<td>A4</td>
<td>B4</td>
<td>C4</td>
<td>D4</td>
</tr>
<tr>
<th>5</th>
<td>A5</td>
<td>B5</td>
<td>C5</td>
<td>D5</td>
</tr>
<tr>
<th>6</th>
<td>A6</td>
<td>B6</td>
<td>C6</td>
<td>D6</td>
</tr>
<tr>
<th>7</th>
<td>A7</td>
<td>B7</td>
<td>C7</td>
<td>D7</td>
</tr>
<tr>
<th>8</th>
<td>A8</td>
<td>B8</td>
<td>C8</td>
<td>D8</td>
</tr>
<tr>
<th>9</th>
<td>A9</td>
<td>B9</td>
<td>C9</td>
<td>D9</td>
</tr>
<tr>
<th>10</th>
<td>A10</td>
<td>B10</td>
<td>C10</td>
<td>D10</td>
</tr>
<tr>
<th>11</th>
<td>A11</td>
<td>B11</td>
<td>C11</td>
<td>D11</td>
</tr>
</tbody>
</table>
</div>
**Concat on axis=1**
```python
pd.concat([df1, df2, df3], axis=1)
```
# 2. Merge
MERGE (or JOIN) is an important function in Data Analysis. It is used to connect/join multiple dataframes together. However, different than `concat`:
- Merge combines dataframes based **on values in shared columns**. Merge function offers more flexibility compared to concat function because it allows combinations based on a condition.
<img src='https://miro.medium.com/max/1400/1*-uSHoxrzM57syqnKnms2iA.png'>
- While Concat function concatenates dataframes along **rows or columns**. We can think of it as stacking up multiple dataframes.
<img src='https://miro.medium.com/max/1400/1*0wu6DunCzPC4o9FIyRTW4w.png'>
[Reference](https://towardsdatascience.com/3-key-differences-between-merge-and-concat-functions-of-pandas-ab2bab224b59)
| [Read more about the documentation](https://pandas.pydata.org/pandas-docs/stable/reference/api/pandas.DataFrame.merge.html)
*The merge function oin Pandas is similar to SQL join concept, which is used to connect many many-to-many relationship tables.*
 <img src='https://i.imgur.com/lnSYp5D.png' width=400>
```python
left = pd.DataFrame({"key": ["K0", "K1", "K2", "K3", "K6", "K7"],
"A": ["A0", "A1", "A2", "A3", "A6", "A7"],
"B": ["B0", "B1", "B2", "B3", "B6", "B7"]})
left
```
<div>
<style scoped>
.dataframe tbody tr th:only-of-type {
vertical-align: middle;
}
.dataframe tbody tr th {
vertical-align: top;
}
.dataframe thead th {
text-align: right;
}
</style>
<table border="1" class="dataframe">
<thead>
<tr style="text-align: right;">
<th></th>
<th>key</th>
<th>A</th>
<th>B</th>
</tr>
</thead>
<tbody>
<tr>
<th>0</th>
<td>K0</td>
<td>A0</td>
<td>B0</td>
</tr>
<tr>
<th>1</th>
<td>K1</td>
<td>A1</td>
<td>B1</td>
</tr>
<tr>
<th>2</th>
<td>K2</td>
<td>A2</td>
<td>B2</td>
</tr>
<tr>
<th>3</th>
<td>K3</td>
<td>A3</td>
<td>B3</td>
</tr>
<tr>
<th>4</th>
<td>K6</td>
<td>A6</td>
<td>B6</td>
</tr>
<tr>
<th>5</th>
<td>K7</td>
<td>A7</td>
<td>B7</td>
</tr>
</tbody>
</table>
</div>
```python
right = pd.DataFrame({"key": ["K0", "K1", "K2", "K3", "K4", "K5"],
"C": ["C0", "C1", "C2", "C3", "C4", "C5"],
"D": ["D0", "D1", "D2", "D3", "D4", "D5"]})
right
```
<div>
<style scoped>
.dataframe tbody tr th:only-of-type {
vertical-align: middle;
}
.dataframe tbody tr th {
vertical-align: top;
}
.dataframe thead th {
text-align: right;
}
</style>
<table border="1" class="dataframe">
<thead>
<tr style="text-align: right;">
<th></th>
<th>key</th>
<th>C</th>
<th>D</th>
</tr>
</thead>
<tbody>
<tr>
<th>0</th>
<td>K0</td>
<td>C0</td>
<td>D0</td>
</tr>
<tr>
<th>1</th>
<td>K1</td>
<td>C1</td>
<td>D1</td>
</tr>
<tr>
<th>2</th>
<td>K2</td>
<td>C2</td>
<td>D2</td>
</tr>
<tr>
<th>3</th>
<td>K3</td>
<td>C3</td>
<td>D3</td>
</tr>
<tr>
<th>4</th>
<td>K4</td>
<td>C4</td>
<td>D4</td>
</tr>
<tr>
<th>5</th>
<td>K5</td>
<td>C5</td>
<td>D5</td>
</tr>
</tbody>
</table>
</div>
```python
# on: which column is used as the key --- tên cột key phải giống nhau ở cả hai bảng
pd.merge(left, right, how='right', on="key")
```
<div>
<style scoped>
.dataframe tbody tr th:only-of-type {
vertical-align: middle;
}
.dataframe tbody tr th {
vertical-align: top;
}
.dataframe thead th {
text-align: right;
}
</style>
<table border="1" class="dataframe">
<thead>
<tr style="text-align: right;">
<th></th>
<th>key</th>
<th>A</th>
<th>B</th>
<th>C</th>
<th>D</th>
</tr>
</thead>
<tbody>
<tr>
<th>0</th>
<td>K0</td>
<td>A0</td>
<td>B0</td>
<td>C0</td>
<td>D0</td>
</tr>
<tr>
<th>1</th>
<td>K1</td>
<td>A1</td>
<td>B1</td>
<td>C1</td>
<td>D1</td>
</tr>
<tr>
<th>2</th>
<td>K2</td>
<td>A2</td>
<td>B2</td>
<td>C2</td>
<td>D2</td>
</tr>
<tr>
<th>3</th>
<td>K3</td>
<td>A3</td>
<td>B3</td>
<td>C3</td>
<td>D3</td>
</tr>
<tr>
<th>4</th>
<td>K4</td>
<td>NaN</td>
<td>NaN</td>
<td>C4</td>
<td>D4</td>
</tr>
<tr>
<th>5</th>
<td>K5</td>
<td>NaN</td>
<td>NaN</td>
<td>C5</td>
<td>D5</td>
</tr>
</tbody>
</table>
</div>
**Merge on two-column key**
```python
left = pd.DataFrame({"key1": ["K0", "K0", "K1", "K2"],
"key2": ["K0", "K1", "K0", "K1"],
"A": ["A0", "A1", "A2", "A3"],
"B": ["B0", "B1", "B2", "B3"]})
left
```
<div>
<style scoped>
.dataframe tbody tr th:only-of-type {
vertical-align: middle;
}
.dataframe tbody tr th {
vertical-align: top;
}
.dataframe thead th {
text-align: right;
}
</style>
<table border="1" class="dataframe">
<thead>
<tr style="text-align: right;">
<th></th>
<th>key1</th>
<th>key2</th>
<th>A</th>
<th>B</th>
</tr>
</thead>
<tbody>
<tr>
<th>0</th>
<td>K0</td>
<td>K0</td>
<td>A0</td>
<td>B0</td>
</tr>
<tr>
<th>1</th>
<td>K0</td>
<td>K1</td>
<td>A1</td>
<td>B1</td>
</tr>
<tr>
<th>2</th>
<td>K1</td>
<td>K0</td>
<td>A2</td>
<td>B2</td>
</tr>
<tr>
<th>3</th>
<td>K2</td>
<td>K1</td>
<td>A3</td>
<td>B3</td>
</tr>
</tbody>
</table>
</div>
```python
right = pd.DataFrame({"key1": ["K0", "K1", "K1", "K2"],
"key2": ["K0", "K0", "K0", "K0"],
"C": ["C0", "C1", "C2", "C3"],
"D": ["D0", "D1", "D2", "D3"]})
right
```
<div>
<style scoped>
.dataframe tbody tr th:only-of-type {
vertical-align: middle;
}
.dataframe tbody tr th {
vertical-align: top;
}
.dataframe thead th {
text-align: right;
}
</style>
<table border="1" class="dataframe">
<thead>
<tr style="text-align: right;">
<th></th>
<th>key1</th>
<th>key2</th>
<th>C</th>
<th>D</th>
</tr>
</thead>
<tbody>
<tr>
<th>0</th>
<td>K0</td>
<td>K0</td>
<td>C0</td>
<td>D0</td>
</tr>
<tr>
<th>1</th>
<td>K1</td>
<td>K0</td>
<td>C1</td>
<td>D1</td>
</tr>
<tr>
<th>2</th>
<td>K1</td>
<td>K0</td>
<td>C2</td>
<td>D2</td>
</tr>
<tr>
<th>3</th>
<td>K2</td>
<td>K0</td>
<td>C3</td>
<td>D3</td>
</tr>
</tbody>
</table>
</div>
```python
pd.merge(left, right, how='inner', on=["key1", "key2"])
```
<div>
<style scoped>
.dataframe tbody tr th:only-of-type {
vertical-align: middle;
}
.dataframe tbody tr th {
vertical-align: top;
}
.dataframe thead th {
text-align: right;
}
</style>
<table border="1" class="dataframe">
<thead>
<tr style="text-align: right;">
<th></th>
<th>key1</th>
<th>key2</th>
<th>A</th>
<th>B</th>
<th>C</th>
<th>D</th>
</tr>
</thead>
<tbody>
<tr>
<th>0</th>
<td>K0</td>
<td>K0</td>
<td>A0</td>
<td>B0</td>
<td>C0</td>
<td>D0</td>
</tr>
<tr>
<th>1</th>
<td>K1</td>
<td>K0</td>
<td>A2</td>
<td>B2</td>
<td>C1</td>
<td>D1</td>
</tr>
<tr>
<th>2</th>
<td>K1</td>
<td>K0</td>
<td>A2</td>
<td>B2</td>
<td>C2</td>
<td>D2</td>
</tr>
</tbody>
</table>
</div>
The **pd.merge** syntax
https://pandas.pydata.org/pandas-docs/stable/reference/api/pandas.DataFrame.merge.html
Noticeable parameters:
- `how`: merge method
- `on`: merge key (if the column names are the same between two tables)
- `right_on`: key column on the right table
- `left_on`: key column on the left table
- `right_index` : True/False (if using key as the right table index)
- `left_index` : True/False (if using key as the left table index)
```python
left = pd.DataFrame({"A": ["A0", "A1", "A2", "A3"],
"B": ["B0", "B1", "B2", "B3"],
"sample": ["C0", "C1", "C2", "C3"]},
index=pd.Index(["KEY1", "KEY2", "KEY3", "KEY4"]))
left
```
<div>
<style scoped>
.dataframe tbody tr th:only-of-type {
vertical-align: middle;
}
.dataframe tbody tr th {
vertical-align: top;
}
.dataframe thead th {
text-align: right;
}
</style>
<table border="1" class="dataframe">
<thead>
<tr style="text-align: right;">
<th></th>
<th>A</th>
<th>B</th>
<th>sample</th>
</tr>
</thead>
<tbody>
<tr>
<th>KEY1</th>
<td>A0</td>
<td>B0</td>
<td>C0</td>
</tr>
<tr>
<th>KEY2</th>
<td>A1</td>
<td>B1</td>
<td>C1</td>
</tr>
<tr>
<th>KEY3</th>
<td>A2</td>
<td>B2</td>
<td>C2</td>
</tr>
<tr>
<th>KEY4</th>
<td>A3</td>
<td>B3</td>
<td>C3</td>
</tr>
</tbody>
</table>
</div>
```python
right = pd.DataFrame({"C": ["C0", "C1", "C2", "C3"],
"D": ["D0", "D1", "D2", "D3"],
"sample": ["C1", "C2", "KEY4", "KEY5"]},
index=pd.Index(["KEY0", "KEY1", "KEY2", "KEY7"]))
right
```
<div>
<style scoped>
.dataframe tbody tr th:only-of-type {
vertical-align: middle;
}
.dataframe tbody tr th {
vertical-align: top;
}
.dataframe thead th {
text-align: right;
}
</style>
<table border="1" class="dataframe">
<thead>
<tr style="text-align: right;">
<th></th>
<th>C</th>
<th>D</th>
<th>sample</th>
</tr>
</thead>
<tbody>
<tr>
<th>KEY0</th>
<td>C0</td>
<td>D0</td>
<td>C1</td>
</tr>
<tr>
<th>KEY1</th>
<td>C1</td>
<td>D1</td>
<td>C2</td>
</tr>
<tr>
<th>KEY2</th>
<td>C2</td>
<td>D2</td>
<td>KEY4</td>
</tr>
<tr>
<th>KEY7</th>
<td>C3</td>
<td>D3</td>
<td>KEY5</td>
</tr>
</tbody>
</table>
</div>
```python
# Merge both tables on indexes
pd.merge(left[['A', 'B']], right[['C', 'D']], how='inner',
left_index=True, right_index=True)
```
<div>
<style scoped>
.dataframe tbody tr th:only-of-type {
vertical-align: middle;
}
.dataframe tbody tr th {
vertical-align: top;
}
.dataframe thead th {
text-align: right;
}
</style>
<table border="1" class="dataframe">
<thead>
<tr style="text-align: right;">
<th></th>
<th>A</th>
<th>B</th>
<th>C</th>
<th>D</th>
</tr>
</thead>
<tbody>
<tr>
<th>KEY1</th>
<td>A0</td>
<td>B0</td>
<td>C1</td>
<td>D1</td>
</tr>
<tr>
<th>KEY2</th>
<td>A1</td>
<td>B1</td>
<td>C2</td>
<td>D2</td>
</tr>
</tbody>
</table>
</div>
🙋🏻♂️ **TIPS**
1/ Key columns are in the same name in tabels --> Use ON
2/ Key colunms have different names in tables --> Use LEFT_ON, RIGHT_ON
3/ Key columns are both indexes in tables --> Use LEFT_INDEX, RIGHT_INDEX
```python
# Merge on left-index and right-sample
pd.merge(left, right, left_index=True, right_on='sample')
```
<div>
<style scoped>
.dataframe tbody tr th:only-of-type {
vertical-align: middle;
}
.dataframe tbody tr th {
vertical-align: top;
}
.dataframe thead th {
text-align: right;
}
</style>
<table border="1" class="dataframe">
<thead>
<tr style="text-align: right;">
<th></th>
<th>sample</th>
<th>A</th>
<th>B</th>
<th>sample_x</th>
<th>C</th>
<th>D</th>
<th>sample_y</th>
</tr>
</thead>
<tbody>
<tr>
<th>KEY2</th>
<td>KEY4</td>
<td>A3</td>
<td>B3</td>
<td>C3</td>
<td>C2</td>
<td>D2</td>
<td>KEY4</td>
</tr>
</tbody>
</table>
</div>
This causes massive headache. To avoid that:
❗️ **Make sure the key columns are BOTH INDEXES or BOTH COLUMNS by using `set_index` or `reset_index`.)**
❗️ **Choosing only neccesary columns from each table before merge.**
# 3. Example 1 - Join tables
Explore the dataset of a phone service. The data includes 2 tables:
- `usage`: user phone usage including minutes of outgoing calls, number of outgoing sms, amount of data usage.
- `device`: information of the user device.
```python
usage = pd.read_csv('https://raw.githubusercontent.com/shanealynn/Pandas-Merge-Tutorial/master/user_usage.csv')
device = pd.read_csv('https://raw.githubusercontent.com/shanealynn/Pandas-Merge-Tutorial/master/user_device.csv').drop(columns='user_id')
```
```python
usage
```
<div>
<style scoped>
.dataframe tbody tr th:only-of-type {
vertical-align: middle;
}
.dataframe tbody tr th {
vertical-align: top;
}
.dataframe thead th {
text-align: right;
}
</style>
<table border="1" class="dataframe">
<thead>
<tr style="text-align: right;">
<th></th>
<th>outgoing_mins_per_month</th>
<th>outgoing_sms_per_month</th>
<th>monthly_mb</th>
<th>use_id</th>
</tr>
</thead>
<tbody>
<tr>
<th>0</th>
<td>21.97</td>
<td>4.82</td>
<td>1557.33</td>
<td>22787</td>
</tr>
<tr>
<th>1</th>
<td>1710.08</td>
<td>136.88</td>
<td>7267.55</td>
<td>22788</td>
</tr>
<tr>
<th>2</th>
<td>1710.08</td>
<td>136.88</td>
<td>7267.55</td>
<td>22789</td>
</tr>
<tr>
<th>3</th>
<td>94.46</td>
<td>35.17</td>
<td>519.12</td>
<td>22790</td>
</tr>
<tr>
<th>4</th>
<td>71.59</td>
<td>79.26</td>
<td>1557.33</td>
<td>22792</td>
</tr>
<tr>
<th>...</th>
<td>...</td>
<td>...</td>
<td>...</td>
<td>...</td>
</tr>
<tr>
<th>235</th>
<td>260.66</td>
<td>68.44</td>
<td>896.96</td>
<td>25008</td>
</tr>
<tr>
<th>236</th>
<td>97.12</td>
<td>36.50</td>
<td>2815.00</td>
<td>25040</td>
</tr>
<tr>
<th>237</th>
<td>355.93</td>
<td>12.37</td>
<td>6828.09</td>
<td>25046</td>
</tr>
<tr>
<th>238</th>
<td>632.06</td>
<td>120.46</td>
<td>1453.16</td>
<td>25058</td>
</tr>
<tr>
<th>239</th>
<td>488.70</td>
<td>906.92</td>
<td>3089.85</td>
<td>25220</td>
</tr>
</tbody>
</table>
<p>240 rows × 4 columns</p>
</div>
```python
device
```
<div>
<style scoped>
.dataframe tbody tr th:only-of-type {
vertical-align: middle;
}
.dataframe tbody tr th {
vertical-align: top;
}
.dataframe thead th {
text-align: right;
}
</style>
<table border="1" class="dataframe">
<thead>
<tr style="text-align: right;">
<th></th>
<th>use_id</th>
<th>platform</th>
<th>platform_version</th>
<th>device</th>
<th>use_type_id</th>
</tr>
</thead>
<tbody>
<tr>
<th>0</th>
<td>22782</td>
<td>ios</td>
<td>10.2</td>
<td>iPhone7,2</td>
<td>2</td>
</tr>
<tr>
<th>1</th>
<td>22783</td>
<td>android</td>
<td>6.0</td>
<td>Nexus 5</td>
<td>3</td>
</tr>
<tr>
<th>2</th>
<td>22784</td>
<td>android</td>
<td>5.1</td>
<td>SM-G903F</td>
<td>1</td>
</tr>
<tr>
<th>3</th>
<td>22785</td>
<td>ios</td>
<td>10.2</td>
<td>iPhone7,2</td>
<td>3</td>
</tr>
<tr>
<th>4</th>
<td>22786</td>
<td>android</td>
<td>6.0</td>
<td>ONE E1003</td>
<td>1</td>
</tr>
<tr>
<th>...</th>
<td>...</td>
<td>...</td>
<td>...</td>
<td>...</td>
<td>...</td>
</tr>
<tr>
<th>267</th>
<td>23049</td>
<td>android</td>
<td>6.0</td>
<td>SM-G900F</td>
<td>1</td>
</tr>
<tr>
<th>268</th>
<td>23050</td>
<td>ios</td>
<td>10.2</td>
<td>iPhone7,2</td>
<td>3</td>
</tr>
<tr>
<th>269</th>
<td>23051</td>
<td>ios</td>
<td>10.2</td>
<td>iPhone7,2</td>
<td>3</td>
</tr>
<tr>
<th>270</th>
<td>23052</td>
<td>ios</td>
<td>10.1</td>
<td>iPhone8,4</td>
<td>3</td>
</tr>
<tr>
<th>271</th>
<td>23053</td>
<td>android</td>
<td>5.1</td>
<td>Vodafone Smart ultra 6</td>
<td>1</td>
</tr>
</tbody>
</table>
<p>272 rows × 5 columns</p>
</div>
A common mistake when working with multiple tables is to merge them all together at the beginning.
- This creates a very large table which is exhausted to run computation. And of course, against the purpose of splitting the data into multiple tables at first hand.
When dealing with multiple tables, we should:
- Define the question that we want to clarify.
- Join ONLY NECCESSARY columns to answer the question.
*In this example, you can actually just join both of them and use for the rest of the assignment. But when you have a table with millions of rows and more than 10 columns. You may want to consider!*
## Question 1: Which platform gets the most Average of Internet monthly usage (MB)?
We notice that the:
- Monthly Usage is in the `usage` table
- Platform is in `device` table
- They both share the same use_id
```python
q1 = pd.merge(left = device[['use_id', 'platform']],
right = usage[['use_id', 'monthly_mb']],
on = 'use_id',
how = 'inner')
q1
```
<div>
<style scoped>
.dataframe tbody tr th:only-of-type {
vertical-align: middle;
}
.dataframe tbody tr th {
vertical-align: top;
}
.dataframe thead th {
text-align: right;
}
</style>
<table border="1" class="dataframe">
<thead>
<tr style="text-align: right;">
<th></th>
<th>use_id</th>
<th>platform</th>
<th>monthly_mb</th>
</tr>
</thead>
<tbody>
<tr>
<th>0</th>
<td>22787</td>
<td>android</td>
<td>1557.33</td>
</tr>
<tr>
<th>1</th>
<td>22788</td>
<td>android</td>
<td>7267.55</td>
</tr>
<tr>
<th>2</th>
<td>22789</td>
<td>android</td>
<td>7267.55</td>
</tr>
<tr>
<th>3</th>
<td>22790</td>
<td>android</td>
<td>519.12</td>
</tr>
<tr>
<th>4</th>
<td>22792</td>
<td>android</td>
<td>1557.33</td>
</tr>
<tr>
<th>...</th>
<td>...</td>
<td>...</td>
<td>...</td>
</tr>
<tr>
<th>154</th>
<td>23043</td>
<td>android</td>
<td>5191.12</td>
</tr>
<tr>
<th>155</th>
<td>23044</td>
<td>android</td>
<td>3114.67</td>
</tr>
<tr>
<th>156</th>
<td>23046</td>
<td>android</td>
<td>5191.12</td>
</tr>
<tr>
<th>157</th>
<td>23049</td>
<td>android</td>
<td>519.12</td>
</tr>
<tr>
<th>158</th>
<td>23053</td>
<td>android</td>
<td>5191.12</td>
</tr>
</tbody>
</table>
<p>159 rows × 3 columns</p>
</div>
```python
q1.groupby('platform')['monthly_mb'].mean()
```
platform
android 4221.387834
ios 961.155000
Name: monthly_mb, dtype: float64
Clearly, customers with Android device use a lot more Internet usage (almost, 5 times of IOS)
## Question 2: *(Your turn)*
Between the two use_type_id, compare the:
- Average of outgoing_mins_per_month
- Average of outgoing_sms_per_month
- Average of monthly_mb
```python
# YOUR CODE HERE
```
```python
#@title Click to view solution
q2 = pd.merge(left = device[['use_id', 'use_type_id']],
right = usage,
on = 'use_id',
how = 'inner')
q2.groupby('use_type_id')[['outgoing_mins_per_month', 'outgoing_sms_per_month', 'monthly_mb']].mean()
# Group 1 is heavy Internet users while Group 2 have a higher amount of phone-call and SMS compared to Group 1.
```
<div>
<style scoped>
.dataframe tbody tr th:only-of-type {
vertical-align: middle;
}
.dataframe tbody tr th {
vertical-align: top;
}
.dataframe thead th {
text-align: right;
}
</style>
<table border="1" class="dataframe">
<thead>
<tr style="text-align: right;">
<th></th>
<th>outgoing_mins_per_month</th>
<th>outgoing_sms_per_month</th>
<th>monthly_mb</th>
</tr>
<tr>
<th>use_type_id</th>
<th></th>
<th></th>
<th></th>
</tr>
</thead>
<tbody>
<tr>
<th>1</th>
<td>201.258535</td>
<td>85.354586</td>
<td>4221.387834</td>
</tr>
<tr>
<th>2</th>
<td>366.060000</td>
<td>293.975000</td>
<td>961.155000</td>
</tr>
</tbody>
</table>
</div>
```python
```
# 4. Example 2 - Self Join
Given a dataset of students' homework submission. One student can submit the homework many times. Each row is one submission.
**How can we know how much time has passed since the first time that student id submited the assignment ?**
```python
students = {'id':['001', '002', '003', '001', '003', '001'],
'submissionAt': ['12/08/2021', '12/08/2021', '13/08/2021', '13/08/2021', '15/08/2021', '17/08/2021']}
students = pd.DataFrame(students)
students['submissionAt'] = pd.to_datetime(students['submissionAt'], dayfirst=True)
students
```
<div>
<style scoped>
.dataframe tbody tr th:only-of-type {
vertical-align: middle;
}
.dataframe tbody tr th {
vertical-align: top;
}
.dataframe thead th {
text-align: right;
}
</style>
<table border="1" class="dataframe">
<thead>
<tr style="text-align: right;">
<th></th>
<th>id</th>
<th>submissionAt</th>
</tr>
</thead>
<tbody>
<tr>
<th>0</th>
<td>001</td>
<td>2021-08-12</td>
</tr>
<tr>
<th>1</th>
<td>002</td>
<td>2021-08-12</td>
</tr>
<tr>
<th>2</th>
<td>003</td>
<td>2021-08-13</td>
</tr>
<tr>
<th>3</th>
<td>001</td>
<td>2021-08-13</td>
</tr>
<tr>
<th>4</th>
<td>003</td>
<td>2021-08-15</td>
</tr>
<tr>
<th>5</th>
<td>001</td>
<td>2021-08-17</td>
</tr>
</tbody>
</table>
</div>
```python
# Step 1: Find the first submission timestamp
first_sub = students.groupby('id')['submissionAt'].min().reset_index()
first_sub
```
<div>
<style scoped>
.dataframe tbody tr th:only-of-type {
vertical-align: middle;
}
.dataframe tbody tr th {
vertical-align: top;
}
.dataframe thead th {
text-align: right;
}
</style>
<table border="1" class="dataframe">
<thead>
<tr style="text-align: right;">
<th></th>
<th>id</th>
<th>submissionAt</th>
</tr>
</thead>
<tbody>
<tr>
<th>0</th>
<td>001</td>
<td>2021-08-12</td>
</tr>
<tr>
<th>1</th>
<td>002</td>
<td>2021-08-12</td>
</tr>
<tr>
<th>2</th>
<td>003</td>
<td>2021-08-13</td>
</tr>
</tbody>
</table>
</div>
```python
# Step 2: Merge within the table
final = pd.merge(students, first_sub, how='left', on='id')
final.columns = ['id', 'submissionAt', 'firstSubmission']
```
```python
final
```
<div>
<style scoped>
.dataframe tbody tr th:only-of-type {
vertical-align: middle;
}
.dataframe tbody tr th {
vertical-align: top;
}
.dataframe thead th {
text-align: right;
}
</style>
<table border="1" class="dataframe">
<thead>
<tr style="text-align: right;">
<th></th>
<th>id</th>
<th>submissionAt</th>
<th>firstSubmission</th>
</tr>
</thead>
<tbody>
<tr>
<th>0</th>
<td>001</td>
<td>2021-08-12</td>
<td>2021-08-12</td>
</tr>
<tr>
<th>1</th>
<td>002</td>
<td>2021-08-12</td>
<td>2021-08-12</td>
</tr>
<tr>
<th>2</th>
<td>003</td>
<td>2021-08-13</td>
<td>2021-08-13</td>
</tr>
<tr>
<th>3</th>
<td>001</td>
<td>2021-08-13</td>
<td>2021-08-12</td>
</tr>
<tr>
<th>4</th>
<td>003</td>
<td>2021-08-15</td>
<td>2021-08-13</td>
</tr>
<tr>
<th>5</th>
<td>001</td>
<td>2021-08-17</td>
<td>2021-08-12</td>
</tr>
</tbody>
</table>
</div>
```python
# Step 3: Get duration
final['Duration'] = final['submissionAt'] - final['firstSubmission']
final
```
<div>
<style scoped>
.dataframe tbody tr th:only-of-type {
vertical-align: middle;
}
.dataframe tbody tr th {
vertical-align: top;
}
.dataframe thead th {
text-align: right;
}
</style>
<table border="1" class="dataframe">
<thead>
<tr style="text-align: right;">
<th></th>
<th>id</th>
<th>submissionAt</th>
<th>firstSubmission</th>
<th>Duration</th>
</tr>
</thead>
<tbody>
<tr>
<th>0</th>
<td>001</td>
<td>2021-08-12</td>
<td>2021-08-12</td>
<td>0 days</td>
</tr>
<tr>
<th>1</th>
<td>002</td>
<td>2021-08-12</td>
<td>2021-08-12</td>
<td>0 days</td>
</tr>
<tr>
<th>2</th>
<td>003</td>
<td>2021-08-13</td>
<td>2021-08-13</td>
<td>0 days</td>
</tr>
<tr>
<th>3</th>
<td>001</td>
<td>2021-08-13</td>
<td>2021-08-12</td>
<td>1 days</td>
</tr>
<tr>
<th>4</th>
<td>003</td>
<td>2021-08-15</td>
<td>2021-08-13</td>
<td>2 days</td>
</tr>
<tr>
<th>5</th>
<td>001</td>
<td>2021-08-17</td>
<td>2021-08-12</td>
<td>5 days</td>
</tr>
</tbody>
</table>
</div>
 Sign in with Wallet
Connect another wallet
Sign in with Wallet
Connect another wallet