---
title: Virgil - Intro To Pandas Seaborn - S81 Apply
tags: Virgil, LearnWorld, IntroPandasSeaborn
---
<a target="_blank" href="https://colab.research.google.com/drive/1kp3s4g2T3zIJ5pU2HeYqx_u_hPRZXy0V"><img src="https://www.tensorflow.org/images/colab_logo_32px.png" />Run in Google Colab</a>
## Review about Python
```python
# Variable
a = 10 + 2
print(a)
```
12
```python
# Comparison
a == 10
```
False
```python
# Gán giá trị 10 cho biến a
a = 10
```
```python
# If/Else Condition
# 1 -- if, elif, else _
# 2 -- nhớ dấu :
# 3 -- indent
if a > 10:
a = a + 5
print("a is greater than 10")
elif a < 10:
print("a is less than 10")
else:
print("a is equal to 10")
```
## Function
**Function** is a group of related statements that performs a specific task.
- Breaking a program into smaller and modular chunks.
- Makes it more organized and manageable.
- Avoids repetition and makes the code reusable.

Layout of a function:
```python
def function_name(parameters):
statement(parameters)
return( )
```
```python
number = 80
if number > 100:
print('More')
else:
print('Less or Equal')
```
Less or Equal
```python
# phím tab
# tab nhiều dòng: bôi đen --> ctrl/cmd + [ hoặc ctrl/cmd + ]
# define a function
# Tất cả lệnh trong function đều cách 1 indent so với 'def'
def check_number(number):
if number > 100:
return 'More'
else:
return 'Equal or Less'
```
```python
a = check_number(10004)
```
```python
# print chỉ display
# return trả về kết qủa
a
```
'More'
## Apply
The Pandas `apply()` is used to apply a function along an axis of the DataFrame or on values of Series.
Example: Classify if ```tip``` amount > 3 then High, else it is Low.
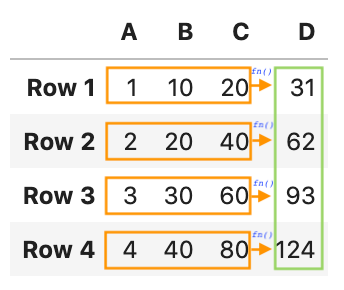
**Example 1** : Apply on a **Dataframe**
The ```apply``` will apply the function on to the whole row of the dataframe.
Thus, we need to define a function that takes the whole row as the parameter.
```python
# One row looks like
df.loc[145]['tip']
```
1.5
```python
def check_tip(row):
if row['tip'] > 3:
return 'High'
else:
return 'Low'
```
```python
# Apply on the dataframe
df.apply(check_tip, axis=1)
```
0 Low
1 Low
2 High
3 High
4 High
...
239 High
240 Low
241 Low
242 Low
243 Low
Length: 244, dtype: object
```python
# Write into the table (tạo 1 cột mới trong bảng)
df['TipType'] = df.apply(check_tip, axis=1)
df
```
<div>
<style scoped>
.dataframe tbody tr th:only-of-type {
vertical-align: middle;
}
.dataframe tbody tr th {
vertical-align: top;
}
.dataframe thead th {
text-align: right;
}
</style>
<table border="1" class="dataframe">
<thead>
<tr style="text-align: right;">
<th></th>
<th>total_bill</th>
<th>tip</th>
<th>sex</th>
<th>smoker</th>
<th>day</th>
<th>time</th>
<th>size</th>
<th>TipType</th>
</tr>
</thead>
<tbody>
<tr>
<th>0</th>
<td>16.99</td>
<td>1.01</td>
<td>Female</td>
<td>No</td>
<td>Sun</td>
<td>Dinner</td>
<td>2</td>
<td>Low</td>
</tr>
<tr>
<th>1</th>
<td>10.34</td>
<td>1.66</td>
<td>Male</td>
<td>No</td>
<td>Sun</td>
<td>Dinner</td>
<td>3</td>
<td>Low</td>
</tr>
<tr>
<th>2</th>
<td>21.01</td>
<td>3.50</td>
<td>Male</td>
<td>No</td>
<td>Sun</td>
<td>Dinner</td>
<td>3</td>
<td>High</td>
</tr>
<tr>
<th>3</th>
<td>23.68</td>
<td>3.31</td>
<td>Male</td>
<td>No</td>
<td>Sun</td>
<td>Dinner</td>
<td>2</td>
<td>High</td>
</tr>
<tr>
<th>4</th>
<td>24.59</td>
<td>3.61</td>
<td>Female</td>
<td>No</td>
<td>Sun</td>
<td>Dinner</td>
<td>4</td>
<td>High</td>
</tr>
<tr>
<th>...</th>
<td>...</td>
<td>...</td>
<td>...</td>
<td>...</td>
<td>...</td>
<td>...</td>
<td>...</td>
<td>...</td>
</tr>
<tr>
<th>239</th>
<td>29.03</td>
<td>5.92</td>
<td>Male</td>
<td>No</td>
<td>Sat</td>
<td>Dinner</td>
<td>3</td>
<td>High</td>
</tr>
<tr>
<th>240</th>
<td>27.18</td>
<td>2.00</td>
<td>Female</td>
<td>Yes</td>
<td>Sat</td>
<td>Dinner</td>
<td>2</td>
<td>Low</td>
</tr>
<tr>
<th>241</th>
<td>22.67</td>
<td>2.00</td>
<td>Male</td>
<td>Yes</td>
<td>Sat</td>
<td>Dinner</td>
<td>2</td>
<td>Low</td>
</tr>
<tr>
<th>242</th>
<td>17.82</td>
<td>1.75</td>
<td>Male</td>
<td>No</td>
<td>Sat</td>
<td>Dinner</td>
<td>2</td>
<td>Low</td>
</tr>
<tr>
<th>243</th>
<td>18.78</td>
<td>3.00</td>
<td>Female</td>
<td>No</td>
<td>Thur</td>
<td>Dinner</td>
<td>2</td>
<td>Low</td>
</tr>
</tbody>
</table>
<p>244 rows × 8 columns</p>
</div>
`axis=1`
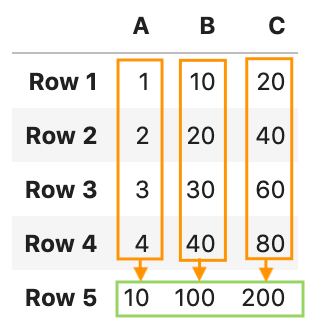
`axis=0`
```python
# Assign it to a column in the dataframe
df['TipType'] = df.apply(check_tip, axis=1)
```
**Example 2**: Apply on a **Series**
The ```apply``` function will be applied on one value at a time. Thus, we need to define the function toward to one value.
```python
df['tip']
```
0 1.01
1 1.66
2 3.50
3 3.31
4 3.61
...
239 5.92
240 2.00
241 2.00
242 1.75
243 3.00
Name: tip, Length: 244, dtype: float64
```python
def check_tip(x):
if x > 3:
return 'High'
else:
return 'Low'
```
```python
# Apply on the Series
df['tip'].apply(check_tip)
```
 Sign in with Wallet
Connect another wallet
Sign in with Wallet
Connect another wallet