# How to Collect Data-Metric from a persistent repository using DevLake.
DevOps is basically continuous integration and continuous delivery. And in devops culture, there is a famous phrase "tools are easy, people are hard." In continuous integration and delivery , continuous evaluation of developers is also essential to make the organisation work properly. And DevLake is one of the efficient tools to make this possible.

This blog post explains the process “How to use advanced JSON and Git Extractors to collect specific data from any overlong repository.”
1. Prerequisite
- AWS Setup.
- How to use multiple tokens.
- How to collect GitHub repository's ID.
2. How to use JSON triggers.
3. Analyzing the Data Collected from the repositories.
4. SQL Database Analyzing.
5. Conclusion.
6. Useful Links
## AWS Setup
You can go through this detailed article posted by one of the community members. {% https://shubham-2001.medium.com/launching-apache-devlake-incubating-on-an-aws-instance-1a9ada1ecc86 %}
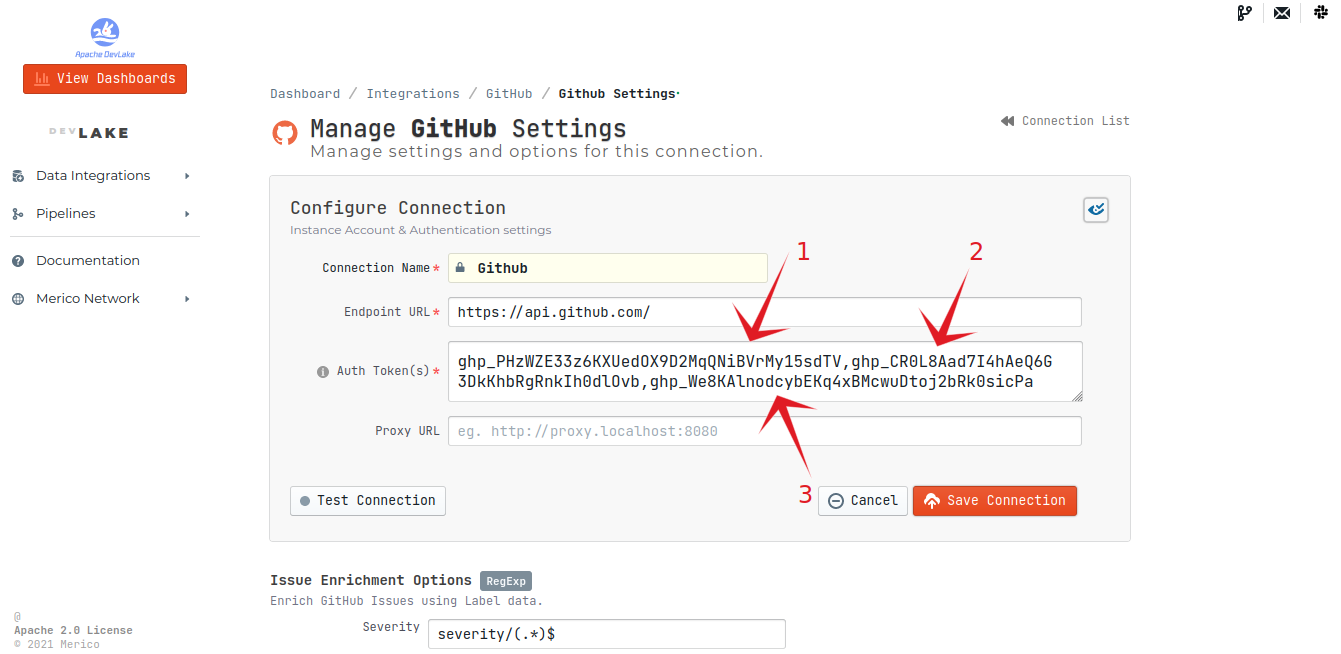
## How to use multiple tokens
We need to use multiple tokens due to the fact that data collection speed is relatively slow for GitHub since they have a rate limit of 5,000 requests per hour (15,000 requests/hour if you pay for GitHub enterprise).
GitHub Settings > Developer settings > Personal access tokens > Generate new token
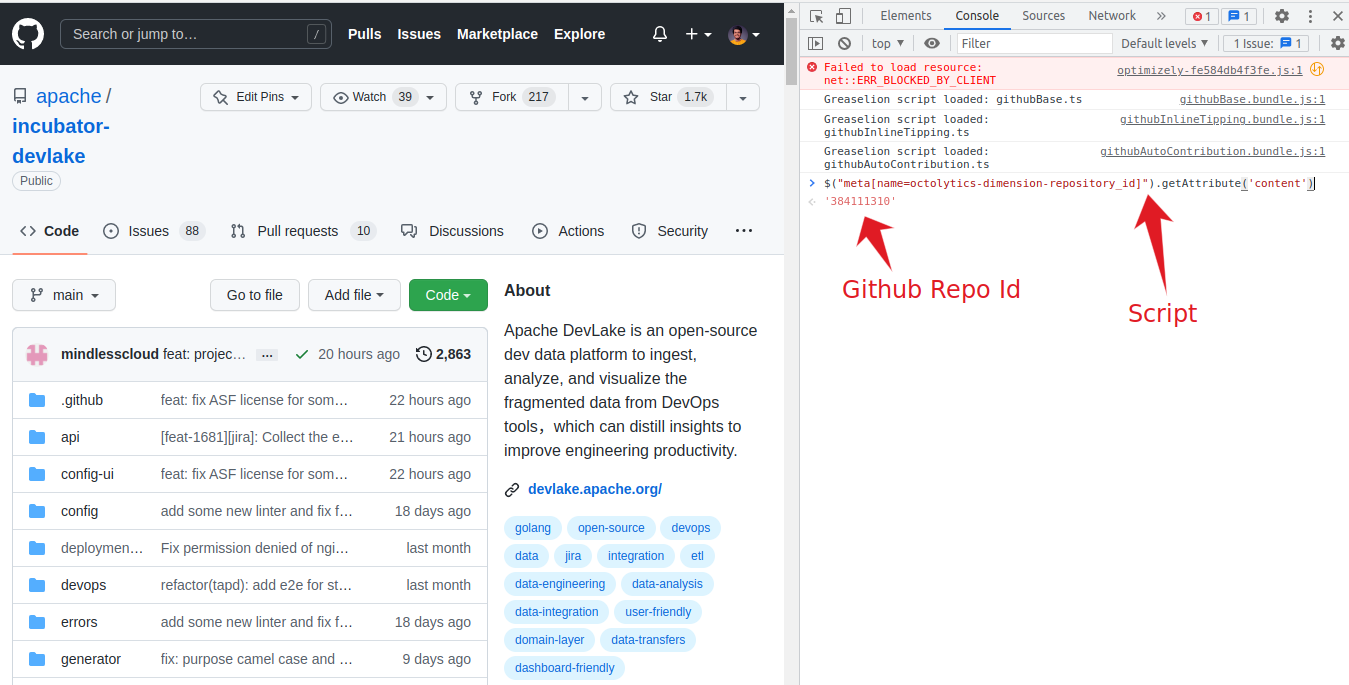
## How to collect GitHub repository’s ID
To collect the repository Id we need to go to the inspect element of the repositories page which we want to analyze > then click on console and paste the script given below this will help you obtain the repository’s ID.
To find the git repository ID we need to use this script.
`$("meta[name=octolytics-dimension-repository_id]").getAttribute('content')`
I didn't find any GUI method to find the repository ID. If anyone finds it, please let me know in the comments.
## JSON Triggers
A JSON trigger contains three different properties
**JSON Trigger events** — A trigger can be set to listen for a named event in the workflow. When the workflow event occurs the trigger will check that any required conditions are met, and if met set one or more actions.
**JSON Trigger conditions** — One or more conditions can be set for a trigger for a named event in the workflow. When the named workflow event occurs the trigger will check that any required condition is met, and if met set one or more actions.
**JSON Trigger actions** — One or more trigger actions can be set for a named event in the workflow. When the workflow event occurs the trigger will check that any required condition is met, and if met the action(s) will occur.
Multiple trigger events can be added to a workflow.
A single trigger event will include one or more actions.
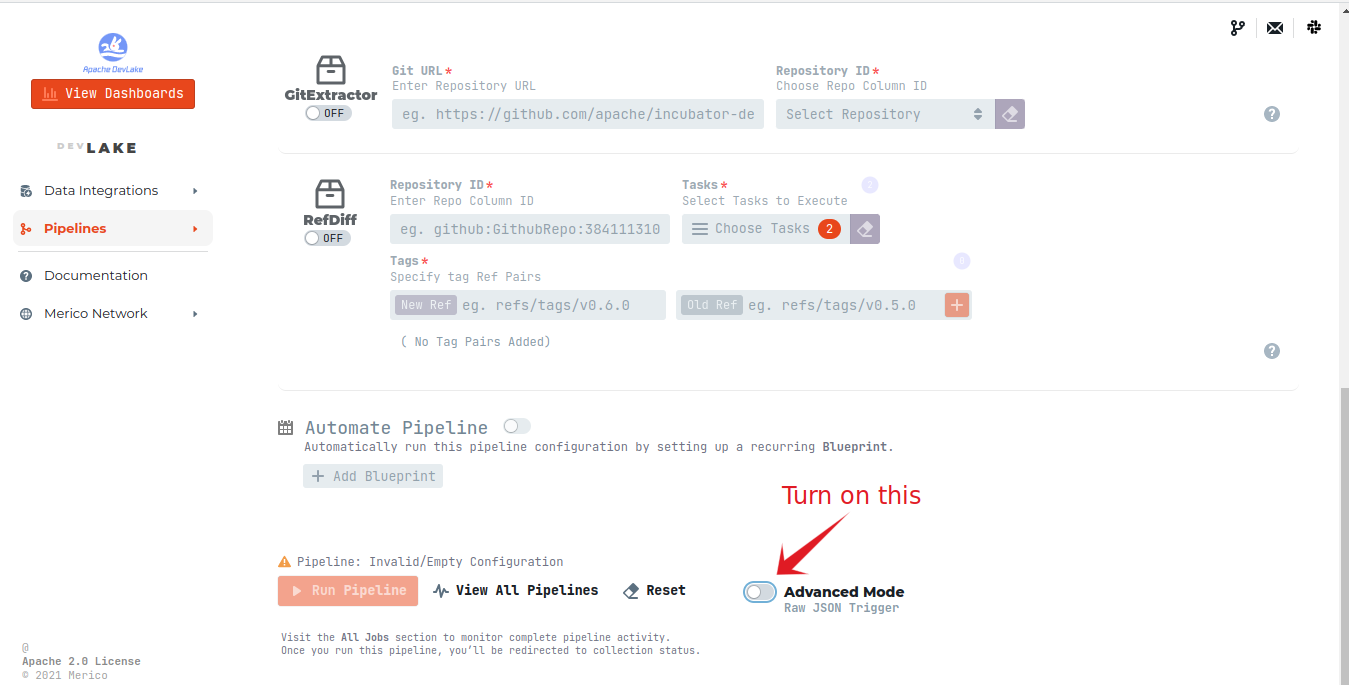
## How to use JSON triggers for collecting specific data
Before moving forward, let's dot down our agendas and what we want to achieve using JSON triggers.
1. We don't want to crunch the whole repositories data.
2. How to use git extractor (This plugin extracts commits and references from a remote or local git repository).
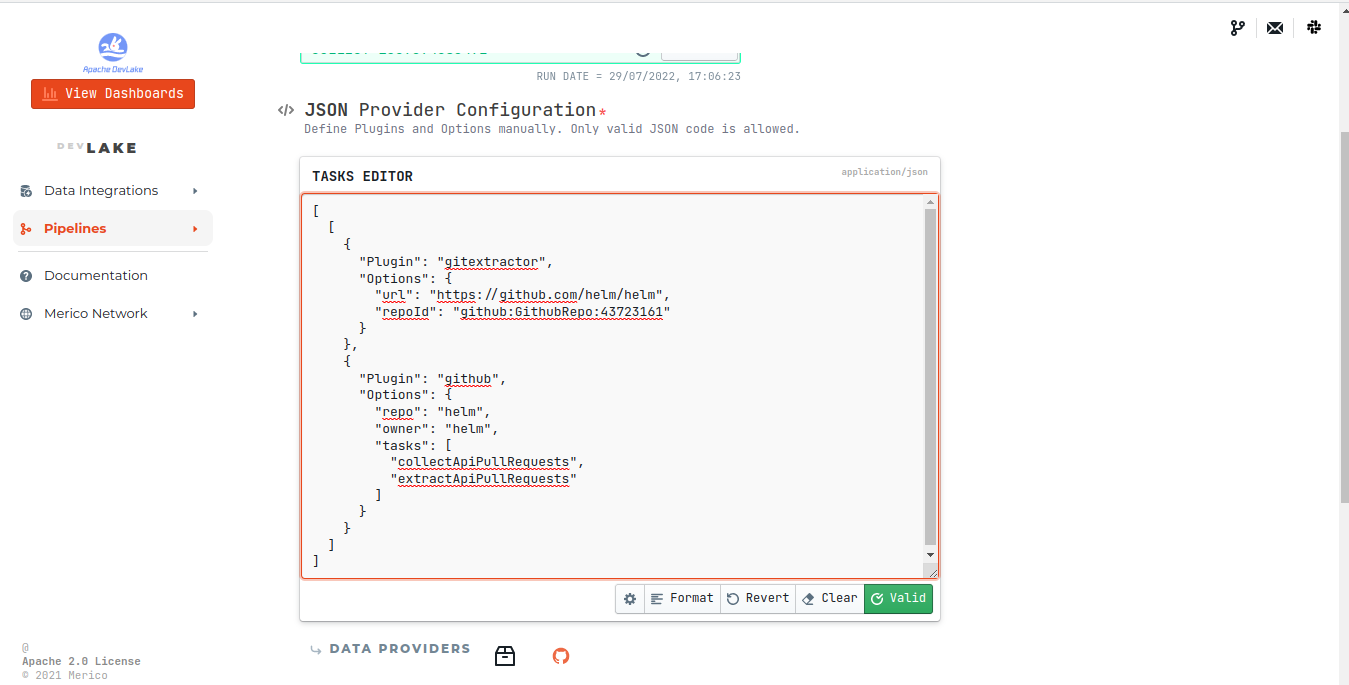
To get through the first hurdle, we have 25+ sub-tasks by which we can easily target the data that we want to analyze.
Use this code snippet by replacing the required value like repository owner name, repository name and repository ID.
```
{
"name": "git repo extractor",
"tasks": [
[
{
"Plugin": "gitextractor",
"Options": {
"url": "https://github.com/merico-dev/lake.git",
"repoId": "github:GithubRepo:384111310"
}
}
]
]
}
```
With the help of JSON triggers and git extractor, you can easily crunch the required data instead of collecting the whole repository's data. Collecting data from entire repositories takes time and requires a lot of hardware. Here comes the sub task section, which helps to extract the particular tasks that are needed.
## Analyzing different GitHub repositories data using DevLake
After the pipelines are created and the extraction of data from repositories is completed, then you have to click on View Dashboards and from the repository (left top corner), select the repository name.
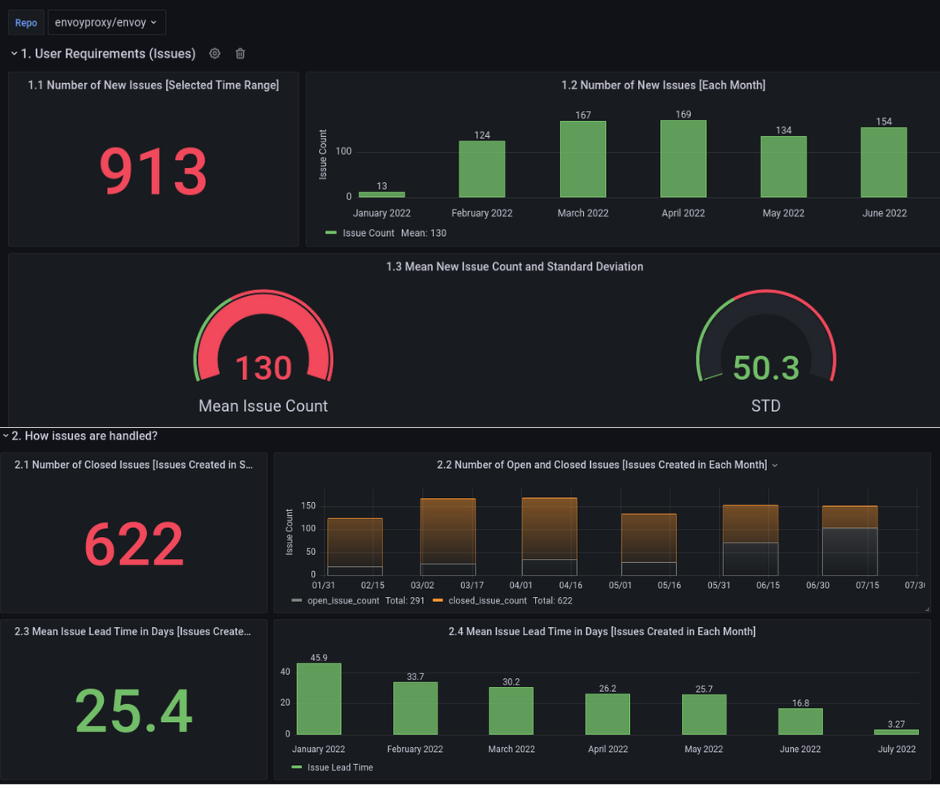
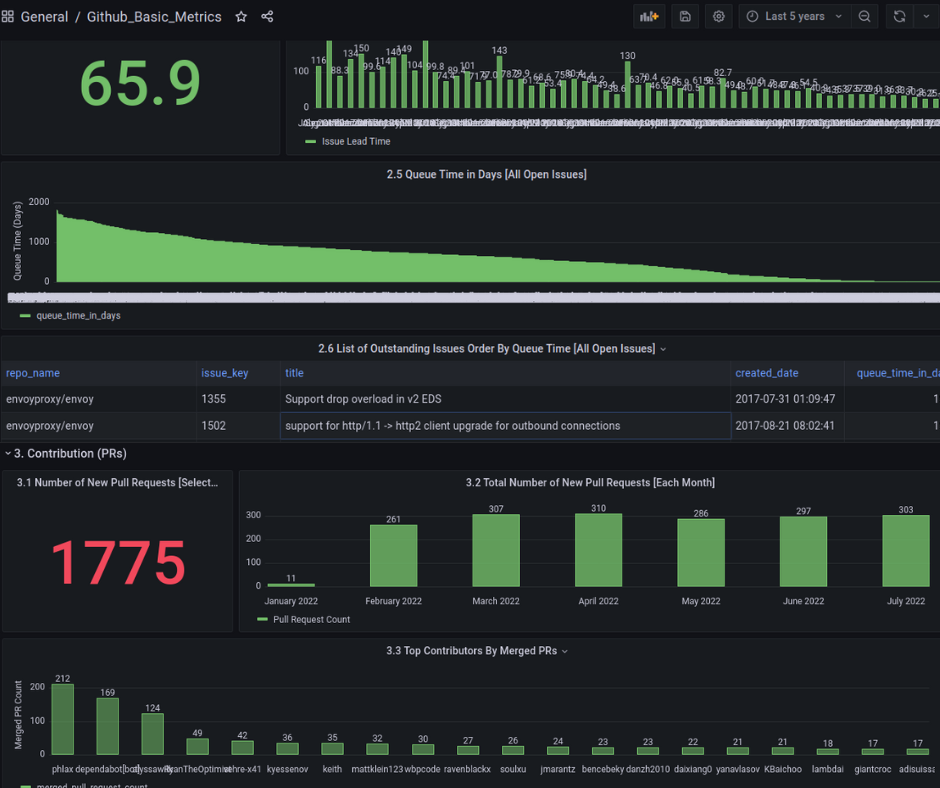
After analysing different longish repositories, we got some insightful information about the repositories in a pictorial representation in Grafana Dashboard. This data consists of all the PRs; issue open , closed , time taken to close the issue.
## SQL Database Analyzing
To analyse the database of mySQL, you can access the mySQL database from the mySQL container.
`docker exec -it [ mysql container id ] bash`
Now change directory to find mySQL its mostly located `usr/bin/mysql`.
It will ask for password : admin
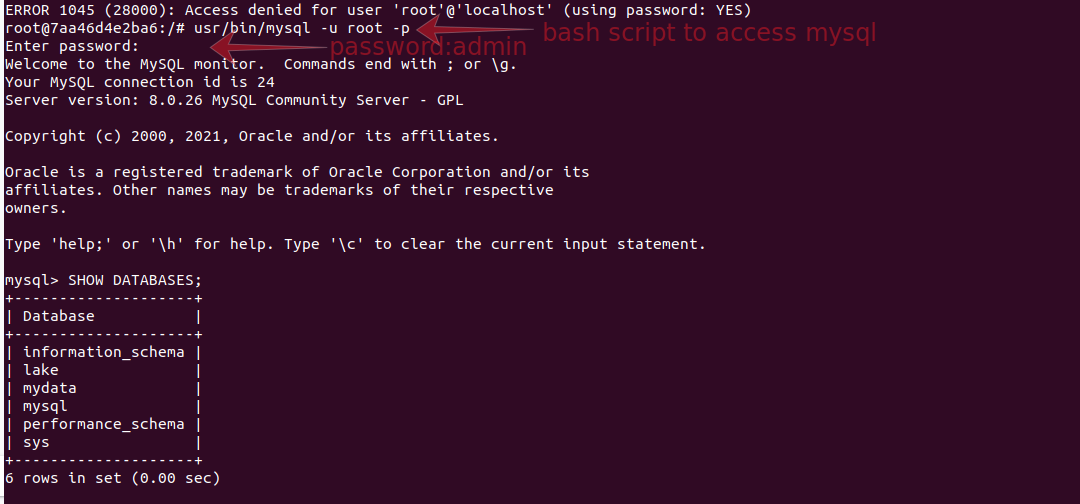
To select the database `use lake`
And to see the tables of the database `SHOW TABLES`
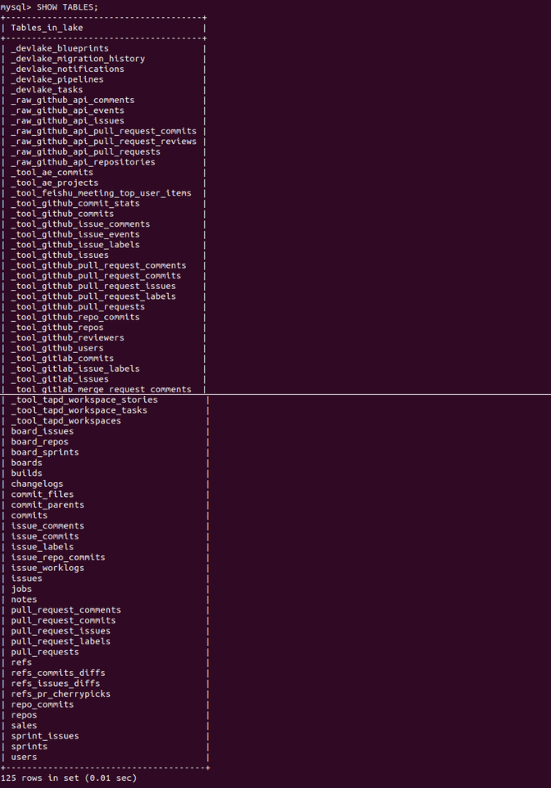
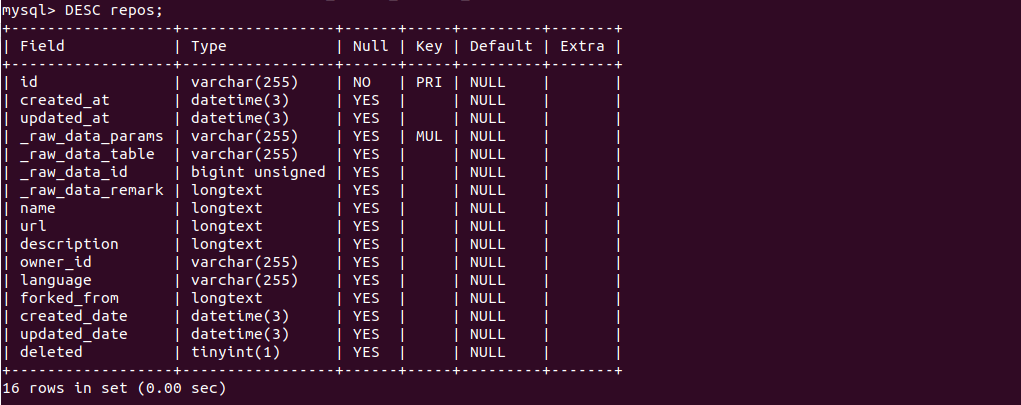
Here are all the repository subtasks that are collected from the repositories. You can access each and every subtask to extract the data from them.
To see the data of any given table `DESC [table name]`
## Conclusion
A combination of subtasks are used to represent the data shown on the Grafana dashboard. This will help the organization to get an exact idea of how efficiently the contributors are working. This helps in the proper structuring and working of the organization at a higher level with more efficient output from the developers.
## Useful Links
https://github.com/merico-dev/lake
https://wiki.comalatech.com/display/CDMC/JSON+Trigger+actions
https://www.merico.dev/