2020 Statistics Camp: Machine Learning
==
2020/9/3-9/4
:round_pushpin: Academia Sinica
## A short tour to neural networks and AI - 黃文良
[PDF](http://www3.stat.sinica.edu.tw/camp2020/files/01_%E9%BB%83%E6%96%87%E8%89%AF%E6%91%98%E8%A6%81.pdf)
* The History of AI
Dartmouth conference, 1956
* Doom period
NN cannot find publications in ML conf (Yann Lecunn)
1. Generation 1: Design classifier
Feature selection + dimensional reduction + classifier
Mathematical model: NN as a feedforward graph (contains no loops). Each neuron computes a nonlinear activation function: sigmoid(monotonically increaing function)
LeCunn's argument: Feature selection is bottleneck(Cannot be automated)
2. Generation 2: DNN
End-to-end: Learning features. Features + Classifier = DNN(Deep learning)
Success factor: GPU, large database
**NN不太有Dimensional reduction和overfitting的問題**
3. Generation 3: Learning/Simplifying DNN architecture
ResNet(High performance & high power) vs MobileNet(Lower performance & lower power)
ResNet: Modularity design
MobilNet: Pruning and quantization(E.g. Continous to discrete) and simplifying convolution
Problem of DNN:
1. Blackbox (Hard to fix if result is bad)
2. Hard to Interpretate
3. 如果要了解數學分析不建議看分類問題
* Convex optimization
* Half-plane cutting vs GAN
* Tree-partition thm
Future works
* DNN with feedback links (time-varing function)
* 在學術界要有原創
* 讀paper要讀key paper(Original), 讀Paper重質不重量
* LA, [Convex Optimization](https://web.stanford.edu/class/ee364a/lectures.html)
* [Neilson book for NN](http://neuralnetworksanddeeplearning.com/)
---
## 結合空間資訊與健康數據之應用 - 詹大千
[PDF](http://www3.stat.sinica.edu.tw/camp2020/files/02_%E8%A9%B9%E5%A4%A7%E5%8D%83%E6%91%98%E8%A6%81.pdf)
* Data visualization is important for statistical research
* 3S: GIS, GPS, Remote Sensing
台灣健保沒有涵蓋抽菸等行為紀錄
* Spatio-temporal data visualization on health care
---
## Causal Inference - 黃彥棕
[PDF](http://www3.stat.sinica.edu.tw/camp2020/files/03_%E9%BB%83%E5%BD%A5%E6%A3%95%E6%8A%95%E5%BD%B1%E7%89%87.pdf)
Sharp causal null hypothesis holds if $\forall$ subject Y(s=1) = Y(s=0)
* Fundamental problem of casual inference
Individual casual effects cannot be determined!
But could be approached doable statistically
If P(Y(s=0)) != P(Y(s=1)), means **average casual effect** existed
No association(correlation) = independence
**Association != causation**
* AI in causal inference
* Association can be used for prediction, but not necessarily causation
So far, AI focuses more on prediction than causation
---
## So you want to work with data - 楊振翔
[PDF](http://www3.stat.sinica.edu.tw/camp2020/files/04_%E6%A5%8A%E6%8C%AF%E7%BF%94%E6%91%98%E8%A6%81.pdf)
1. Data collection and access
2. Data processing
Garbage in garbage out
4. Data analysis
The dimension of the data far exceeds the sample size
* Data integration
Vertical integration- different aspects of same cohort
Horizontal integration- same aspects of different cohort
---
## Data driven discovery and Storytelling using Visualization - 馬匡六
[PDF](http://www3.stat.sinica.edu.tw/camp2020/files/05_%E9%A6%AC%E5%8C%A1%E5%85%AD%E6%91%98%E8%A6%81.pdf)
* Data became an asset
* Anscombe's Quartet (Same statistics but distinct datasets)

* Data visualization might be misleading
* Storytelling comics
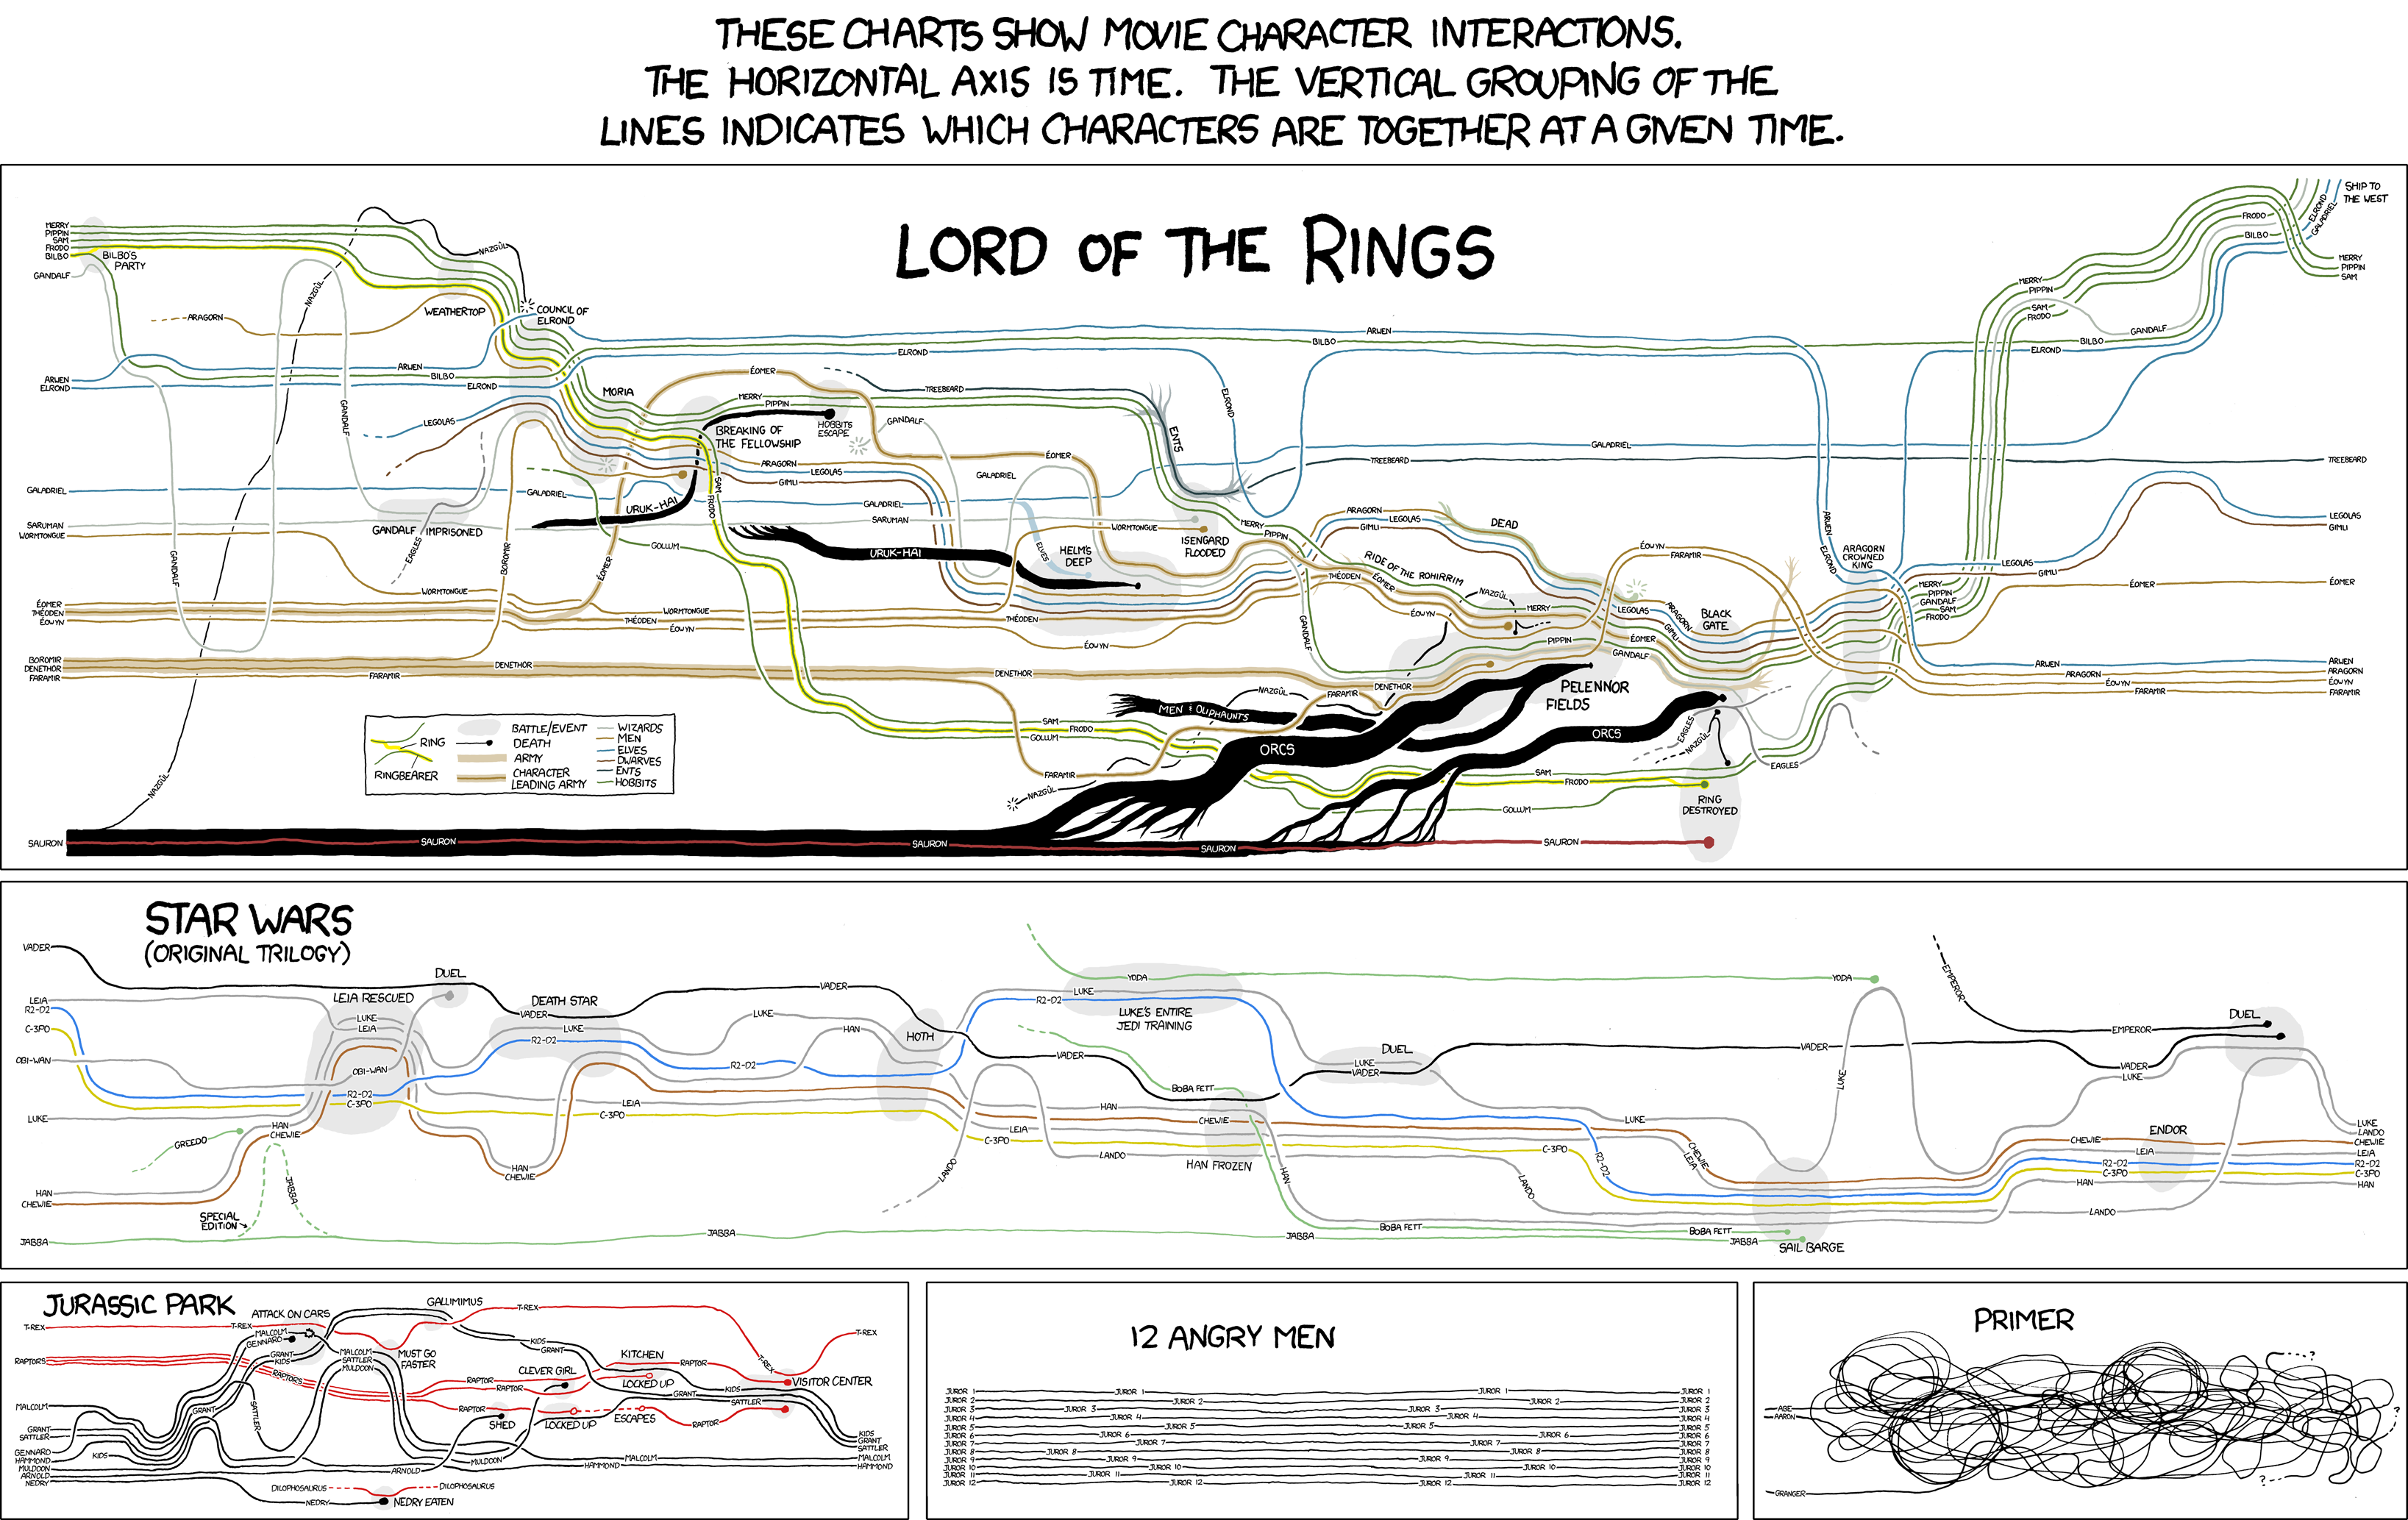
[Ref](https://xkcd.com/)
1. E-commerce data visualization
Visualizing Parallel Matrix Multiplication
2. High-dimensional data
Dimensionality reduction, e.g. PCA, LDA, t-SNE, UMAP, etc.
4. Constrastive Learning
* cPCA (Constrastive Principal Component Ananlysis)
Limits of cPCA: 1. Not suitable for categorical data 2. Only for binary data
* ccPCA (Contrasting CLusters in PCA)
5. Network data visualization
* Sensitivity analysis
---
## A glimpse of online learning - 李彥寰
[PDF](http://www3.stat.sinica.edu.tw/camp2020/files/06_%E6%9D%8E%E5%BD%A5%E5%AF%B0%E6%8A%95%E5%BD%B1%E7%89%87.pdf)
### Individual sequence prediction
* Optimal answers to referendums
* Worst-case formulation
* Sequential model
Prediction space:= $\Gamma = \left \{ 0,1 \right \}\ or\ \Delta \subset \mathbb{R}^2$
Outcome space:= $\Omega = \left \{ 0,1 \right \}$
Loss function:= $\lambda : \Gamma \times \Omega \rightarrow \mathbb{R}$
Algorithm based on previous data, reveal new data while updating algorithm
* Regret
* Online-to-batch conversion
* Mixture forecaster
$\lambda( \gamma, \omega):= -log\gamma(\omega)$
* Universal coding, MDL
1. Uniform prior: Laplace mixture
2. Dirichlet prior: Krichevsky-Trofimov mixture
Two remarks
1. Probability theory is not the only appoach to dealing with uncertainty.
2. A Bayes algorithm can have a non-Bayesain non-probabilistic interpretation and guarantee
[Recommended Book](https://www.amazon.com/Prediction-Learning-Games-Nicolo-Cesa-Bianchi/dp/0521841089#ace-g9859629705)
[COLT](http://learningtheory.org/colt2020/)
---
## Statistical approach of dimension reduction - 黃名鉞
[PDF](http://www3.stat.sinica.edu.tw/camp2020/files/07_%E9%BB%83%E5%90%8D%E9%89%9E%E6%91%98%E8%A6%81.pdf)
### Supervised learning
* Regression analysis
* Parametric models (Dim = #Parameters) / Semiparametric models (dist. is unknown)
* Nonparametric method
Disadvantages:
1. Hard to visualize
2. Curse of dimensionality
3. Overparametrization
* Esimation method
1. Pseudo Least Squares Estimation
2. Pseudo MLE, which also has classical MLE's properties(Optimality)
* Nuisance tangent space
Conclusion
1. Optimality depends on the criterion of interest
2. Implementation: Nonlinear optimization problems
3. When random sample is not available: survivalm analysis, causal inference, etc.
---
## Discussion
* Math should not be the only way to prove things
* Statistics should not be the only method to illustrate relationship between data
 Sign in with Wallet
Connect another wallet
Sign in with Wallet
Connect another wallet