---
tags: jk, essentials
---
# essentialsLab
## Intro Mission Sequence
link to [Showcase LLUF Intro Missions Here!](/3KD7vxygQgCWcqOODzWzoA)
### [Sophie-W](/y6vV_78MSxiCo-TpHgP6ZQ)
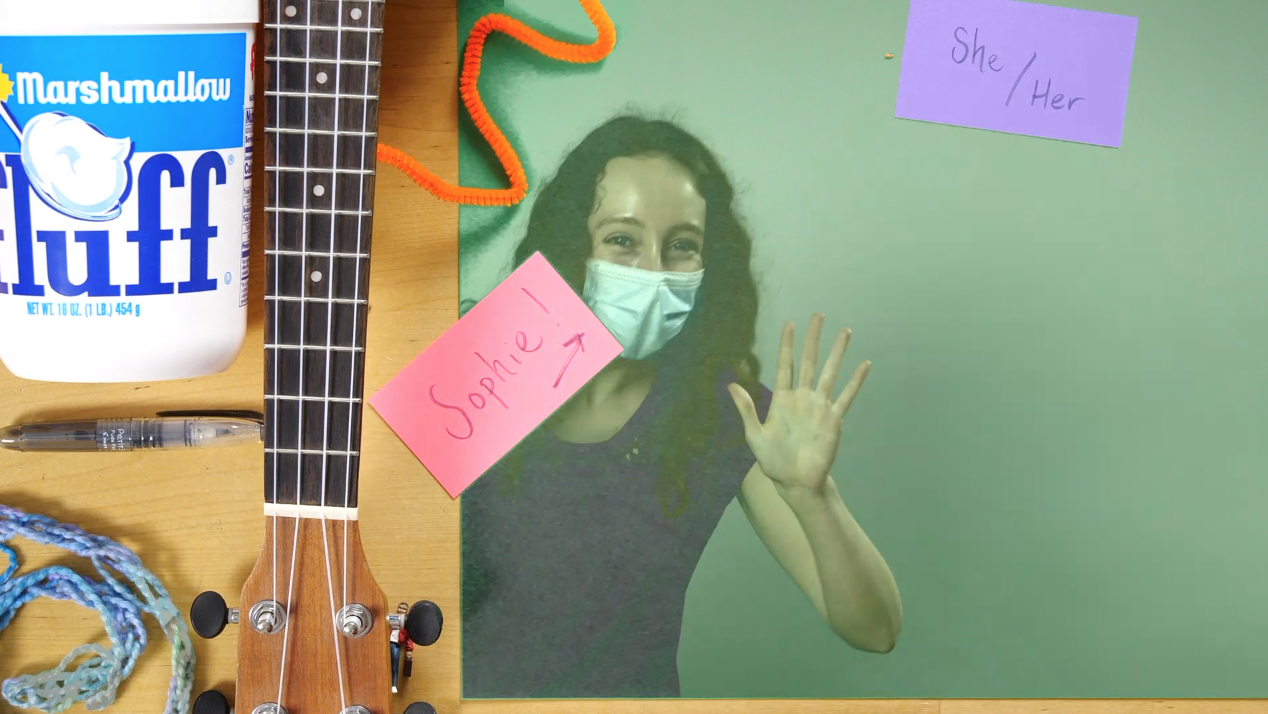
In my intro mission sequence, I emphasized my goals for this year as a LLUF. I created a 'charcuterie plate' displaying a few facets of my identity and revealed it from under the blue velvety cloche! After introducing myself, I discussed a tool I wanted to employ in the LL: mapping. I touched on tthe advantages of using mapping as a tool for visualizing data, as it leverages our intuition for geographies we know and allows us to quickly understand spatial or temporal patterns. In order to record and edit the video, I learned to use the video camera set-up in the small studio. I set a key to create a green screen effect. I walked away from the activity feeling a lot more confident and knowledgeable about the LL tech set-up. Next time, I look forward to experimenting with a multi-camera set-up or doing a more complex green-screen effect, like projecting external media. Also, while I did create a summary GIF from my intro sequence, I didn't have enough space on my computer to export it; I look forward to doing so next time I visit the LL!
### [Aissata-B](/yr-v3y5DTBS5hlLSgH2wOQ)
<iframe src="https://player.vimeo.com/video/655488135?h=c98504552d" width="640" height="360" frameborder="0" allow="autoplay; fullscreen; picture-in-picture" allowfullscreen></iframe>
<p><a href="https://vimeo.com/655488135">Aissata's Intromission</a> from <a href="https://vimeo.com/user123901653">LLFellows</a> on <a href="https://vimeo.com">Vimeo</a>.</p>
> "This is my ‘All About Me’ video that I created at the start of the semester. I used Adobe Premiere to compile the footage together. There was a lot of planning that I did in creating my workspace and outlining what I want to say. This project helped me get familiar with the equipment in the Learning Lab, especially using the AMX, and reacclimate myself with basic functions and tools in Premiere. I am excited to continue learning how to produce different picture-in-picture/green screen configurations on the AMX and identifying which set-ups might be most useful in different circumstances."
## graphicsLab module
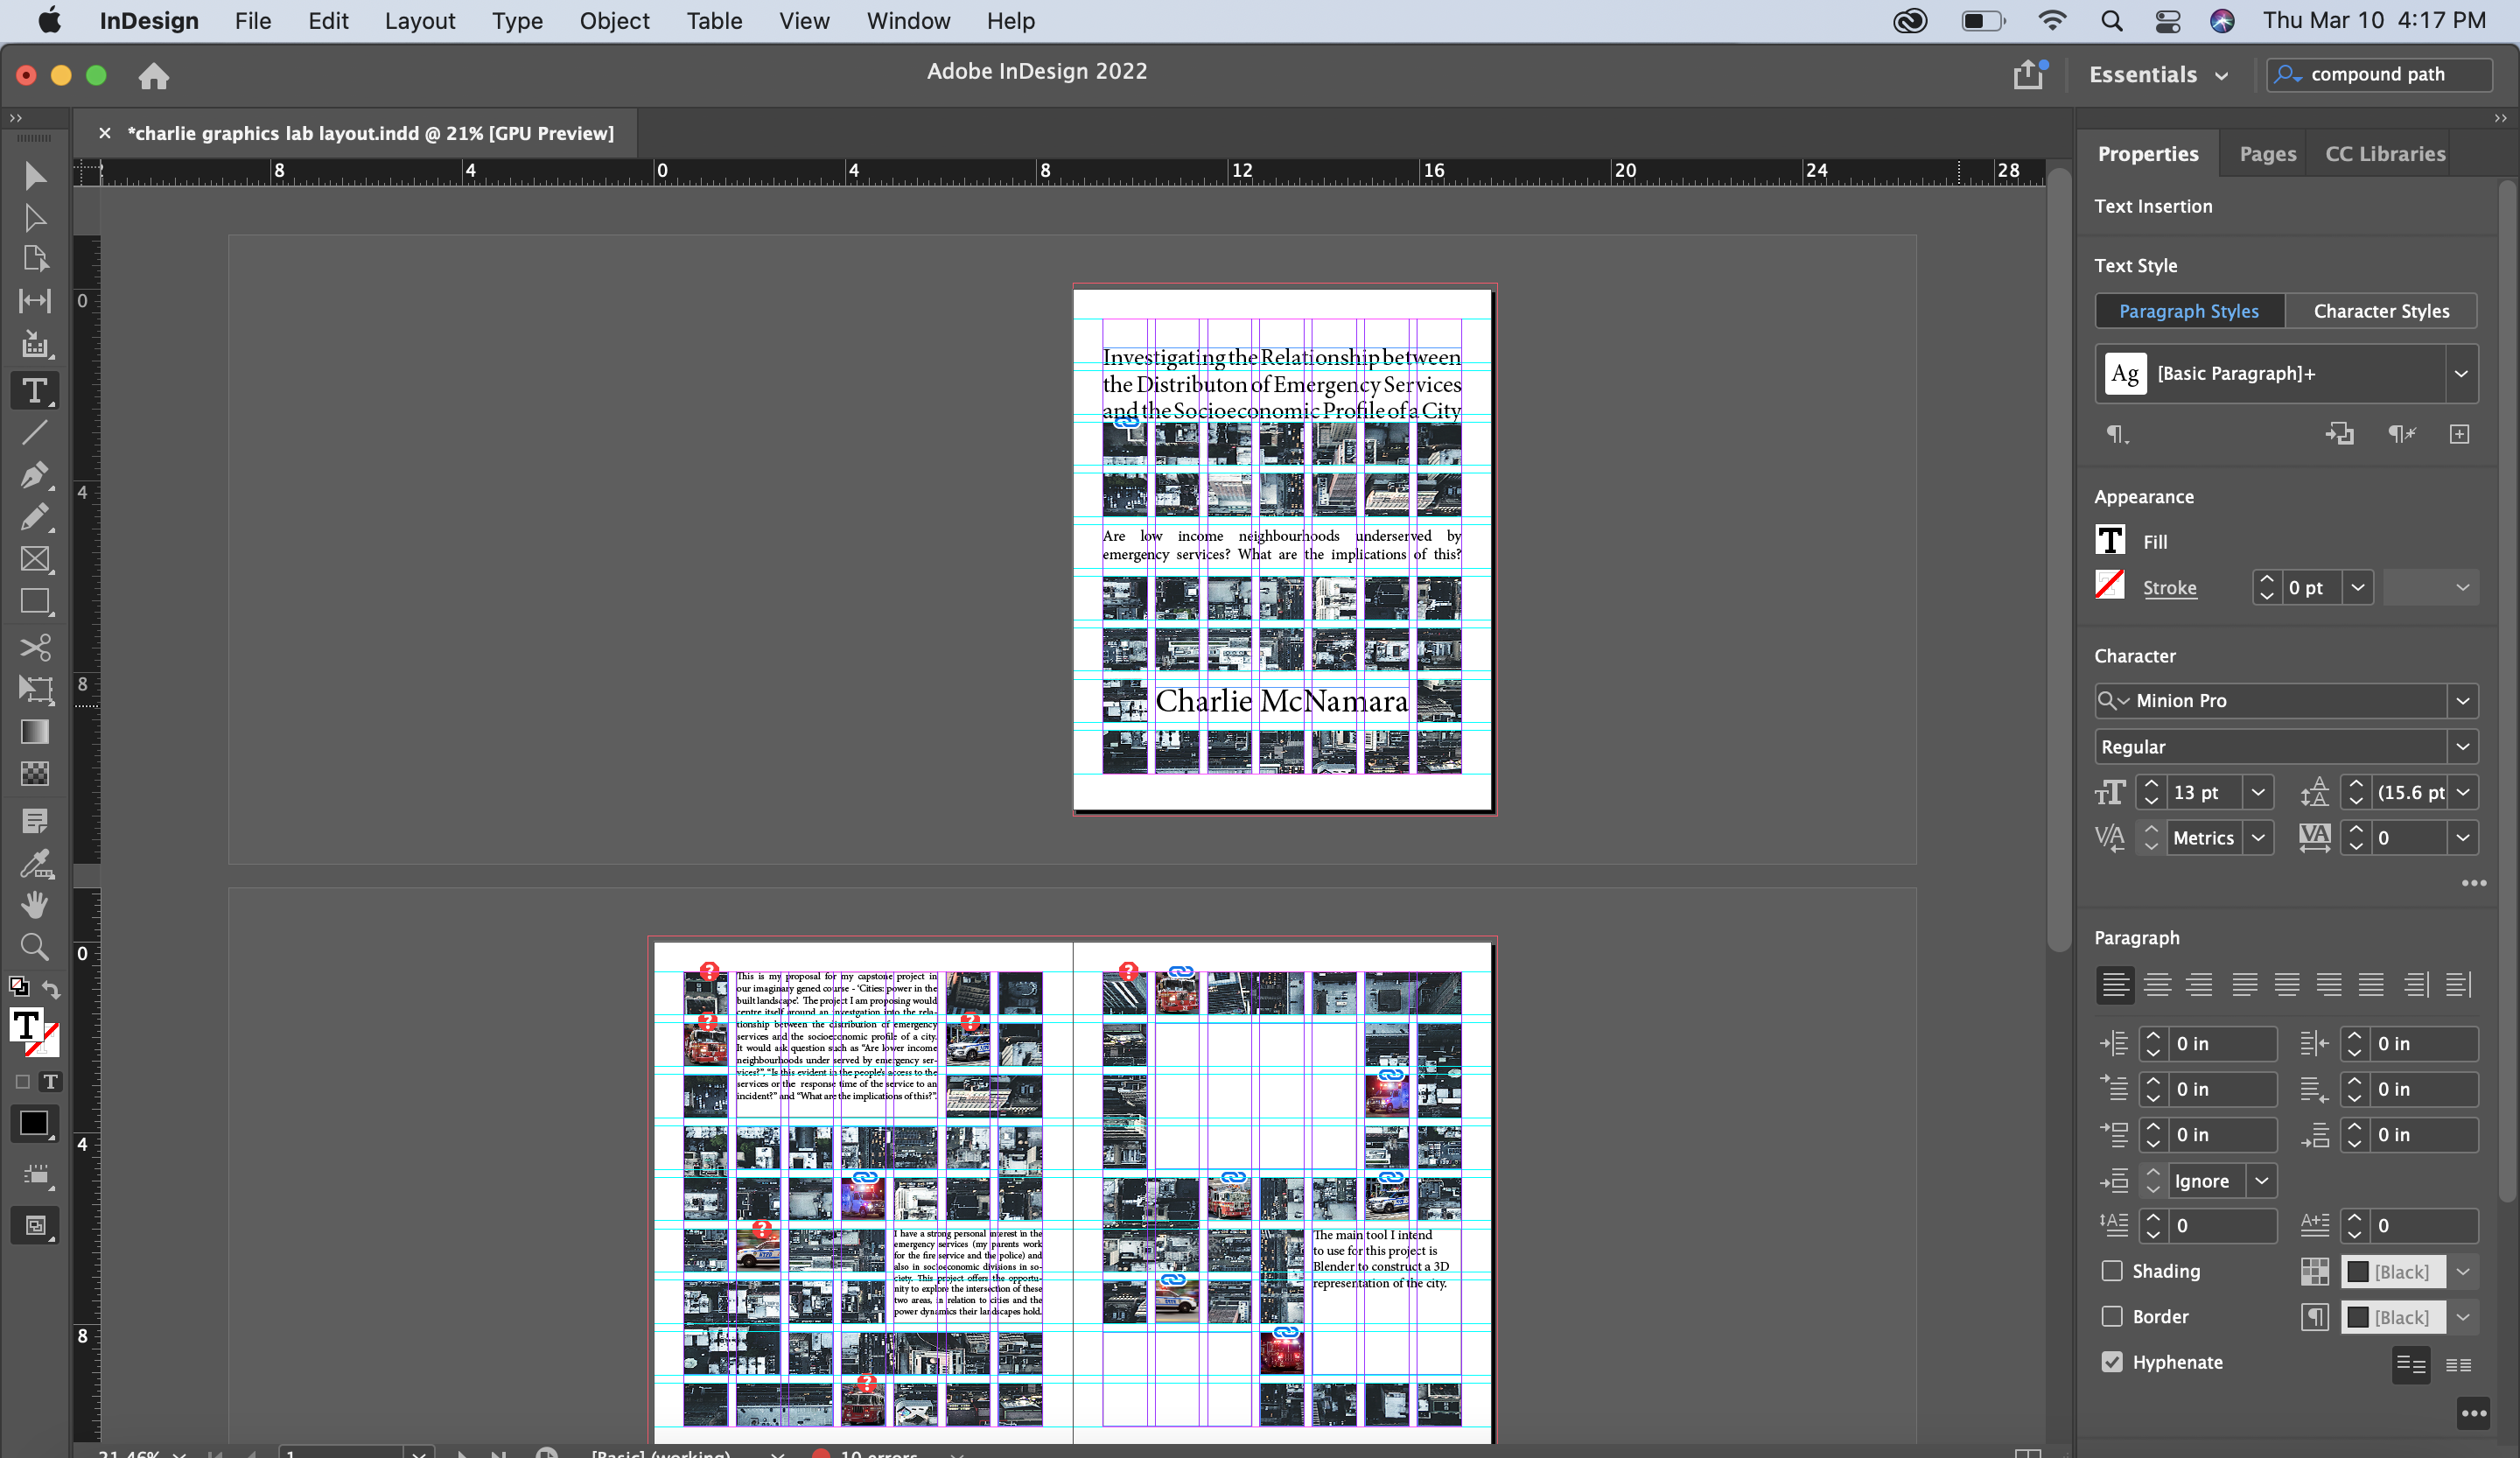
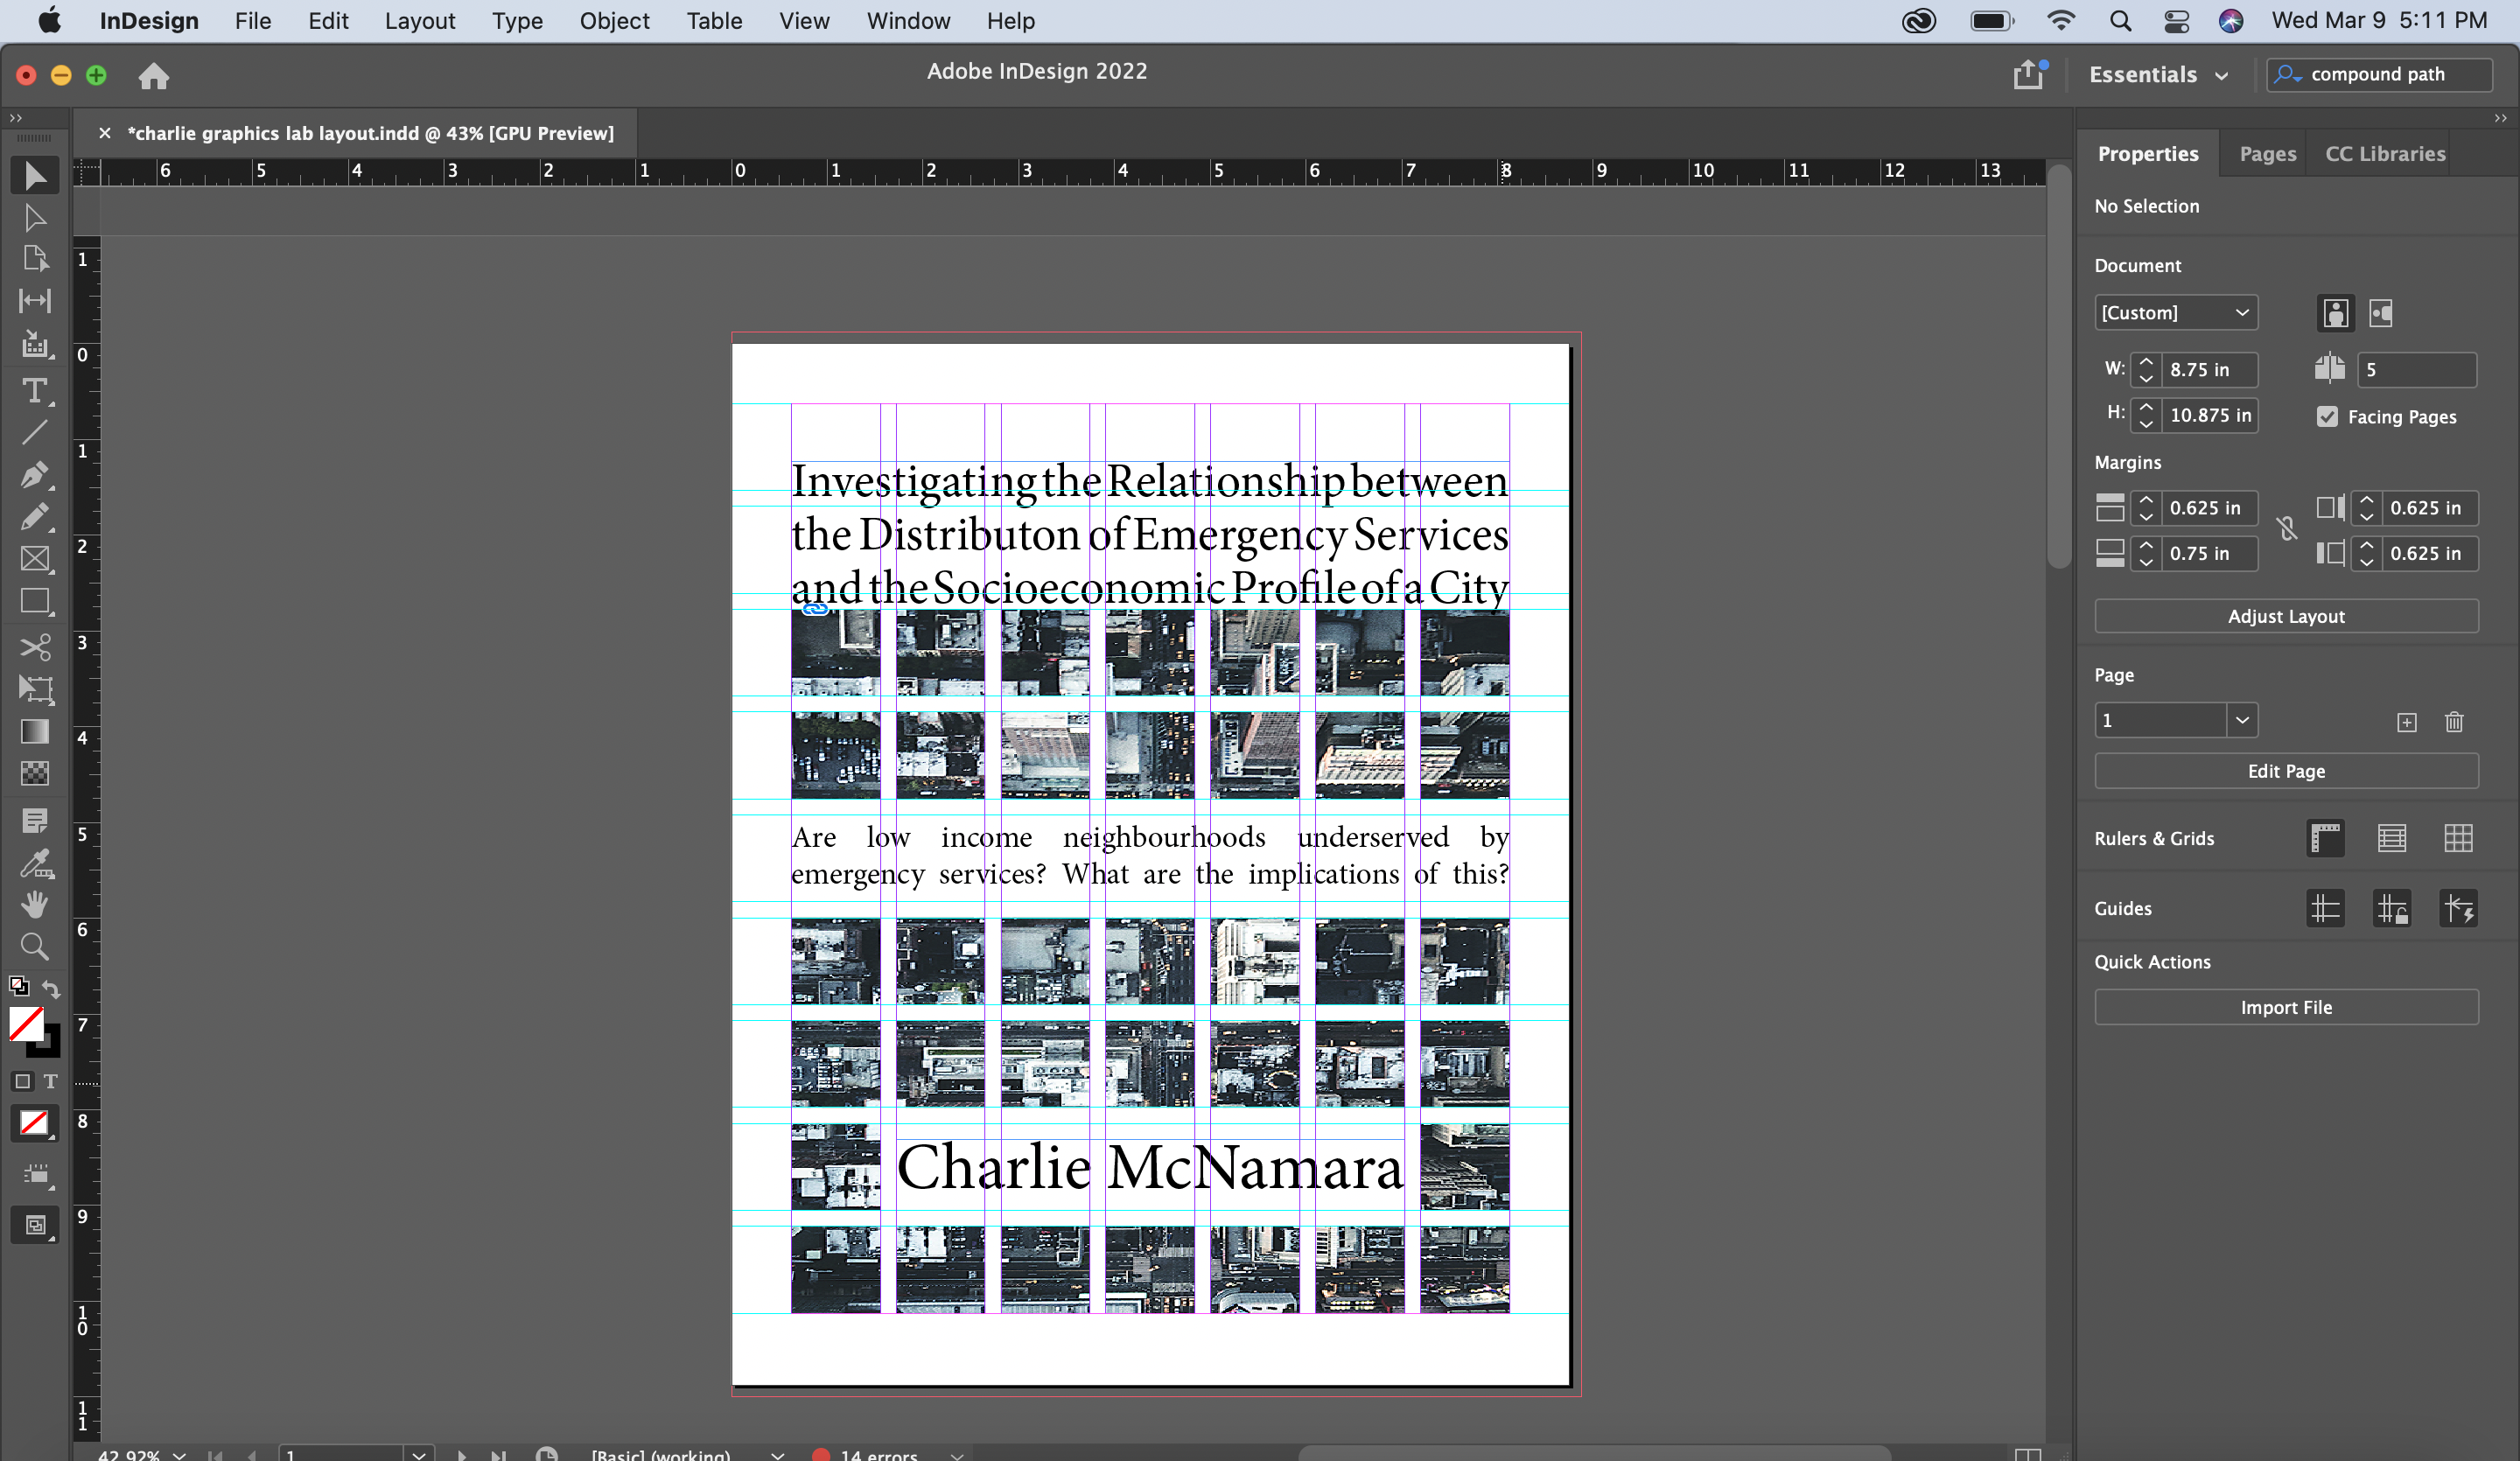
### Charlie's project proposal layout
For our imaginary Gened (Cities: Power in the Built Landscape), I had decided I wanted to explore the relationship between the distribution of emergency services and socioeconomic profile of a city. The first task was to create a project proposal in the form of a magazine layout. Using Adobe InDesign, I created this 5 page spread that detailed the research questions, my intended process, potential challenges or limitations and what I hoped the final product would represent.
This process was as much about learning to navigate InDesign as it was about the thinking process of how I would approach this project. It made me question my data sources, which tools I intended to use, and how I could most effectively present the information I wanted to share.
## realityLab module
### Charlie's annotated 3D model
The first step was finding sources for my data; I chose to work with London because it was most familiar to me and a lot of information is available with a breakdown by borough. I found average response times for the police and fire services; response times for ambulances weren't available by borough, but I counted the number of ambulance stations each had instead. In terms of building a socioeconomic profile of the city, I found data on poverty, income inequality, child poverty and unemployment.
The next step was to represent this infoprmation in blender; I created objects for each borough, whose height was calcuated as an average response time, and each borugh was laid out in a rough geographic translation of the London landscape. This allows a viewer to compare how response times vary from inner to outer London.
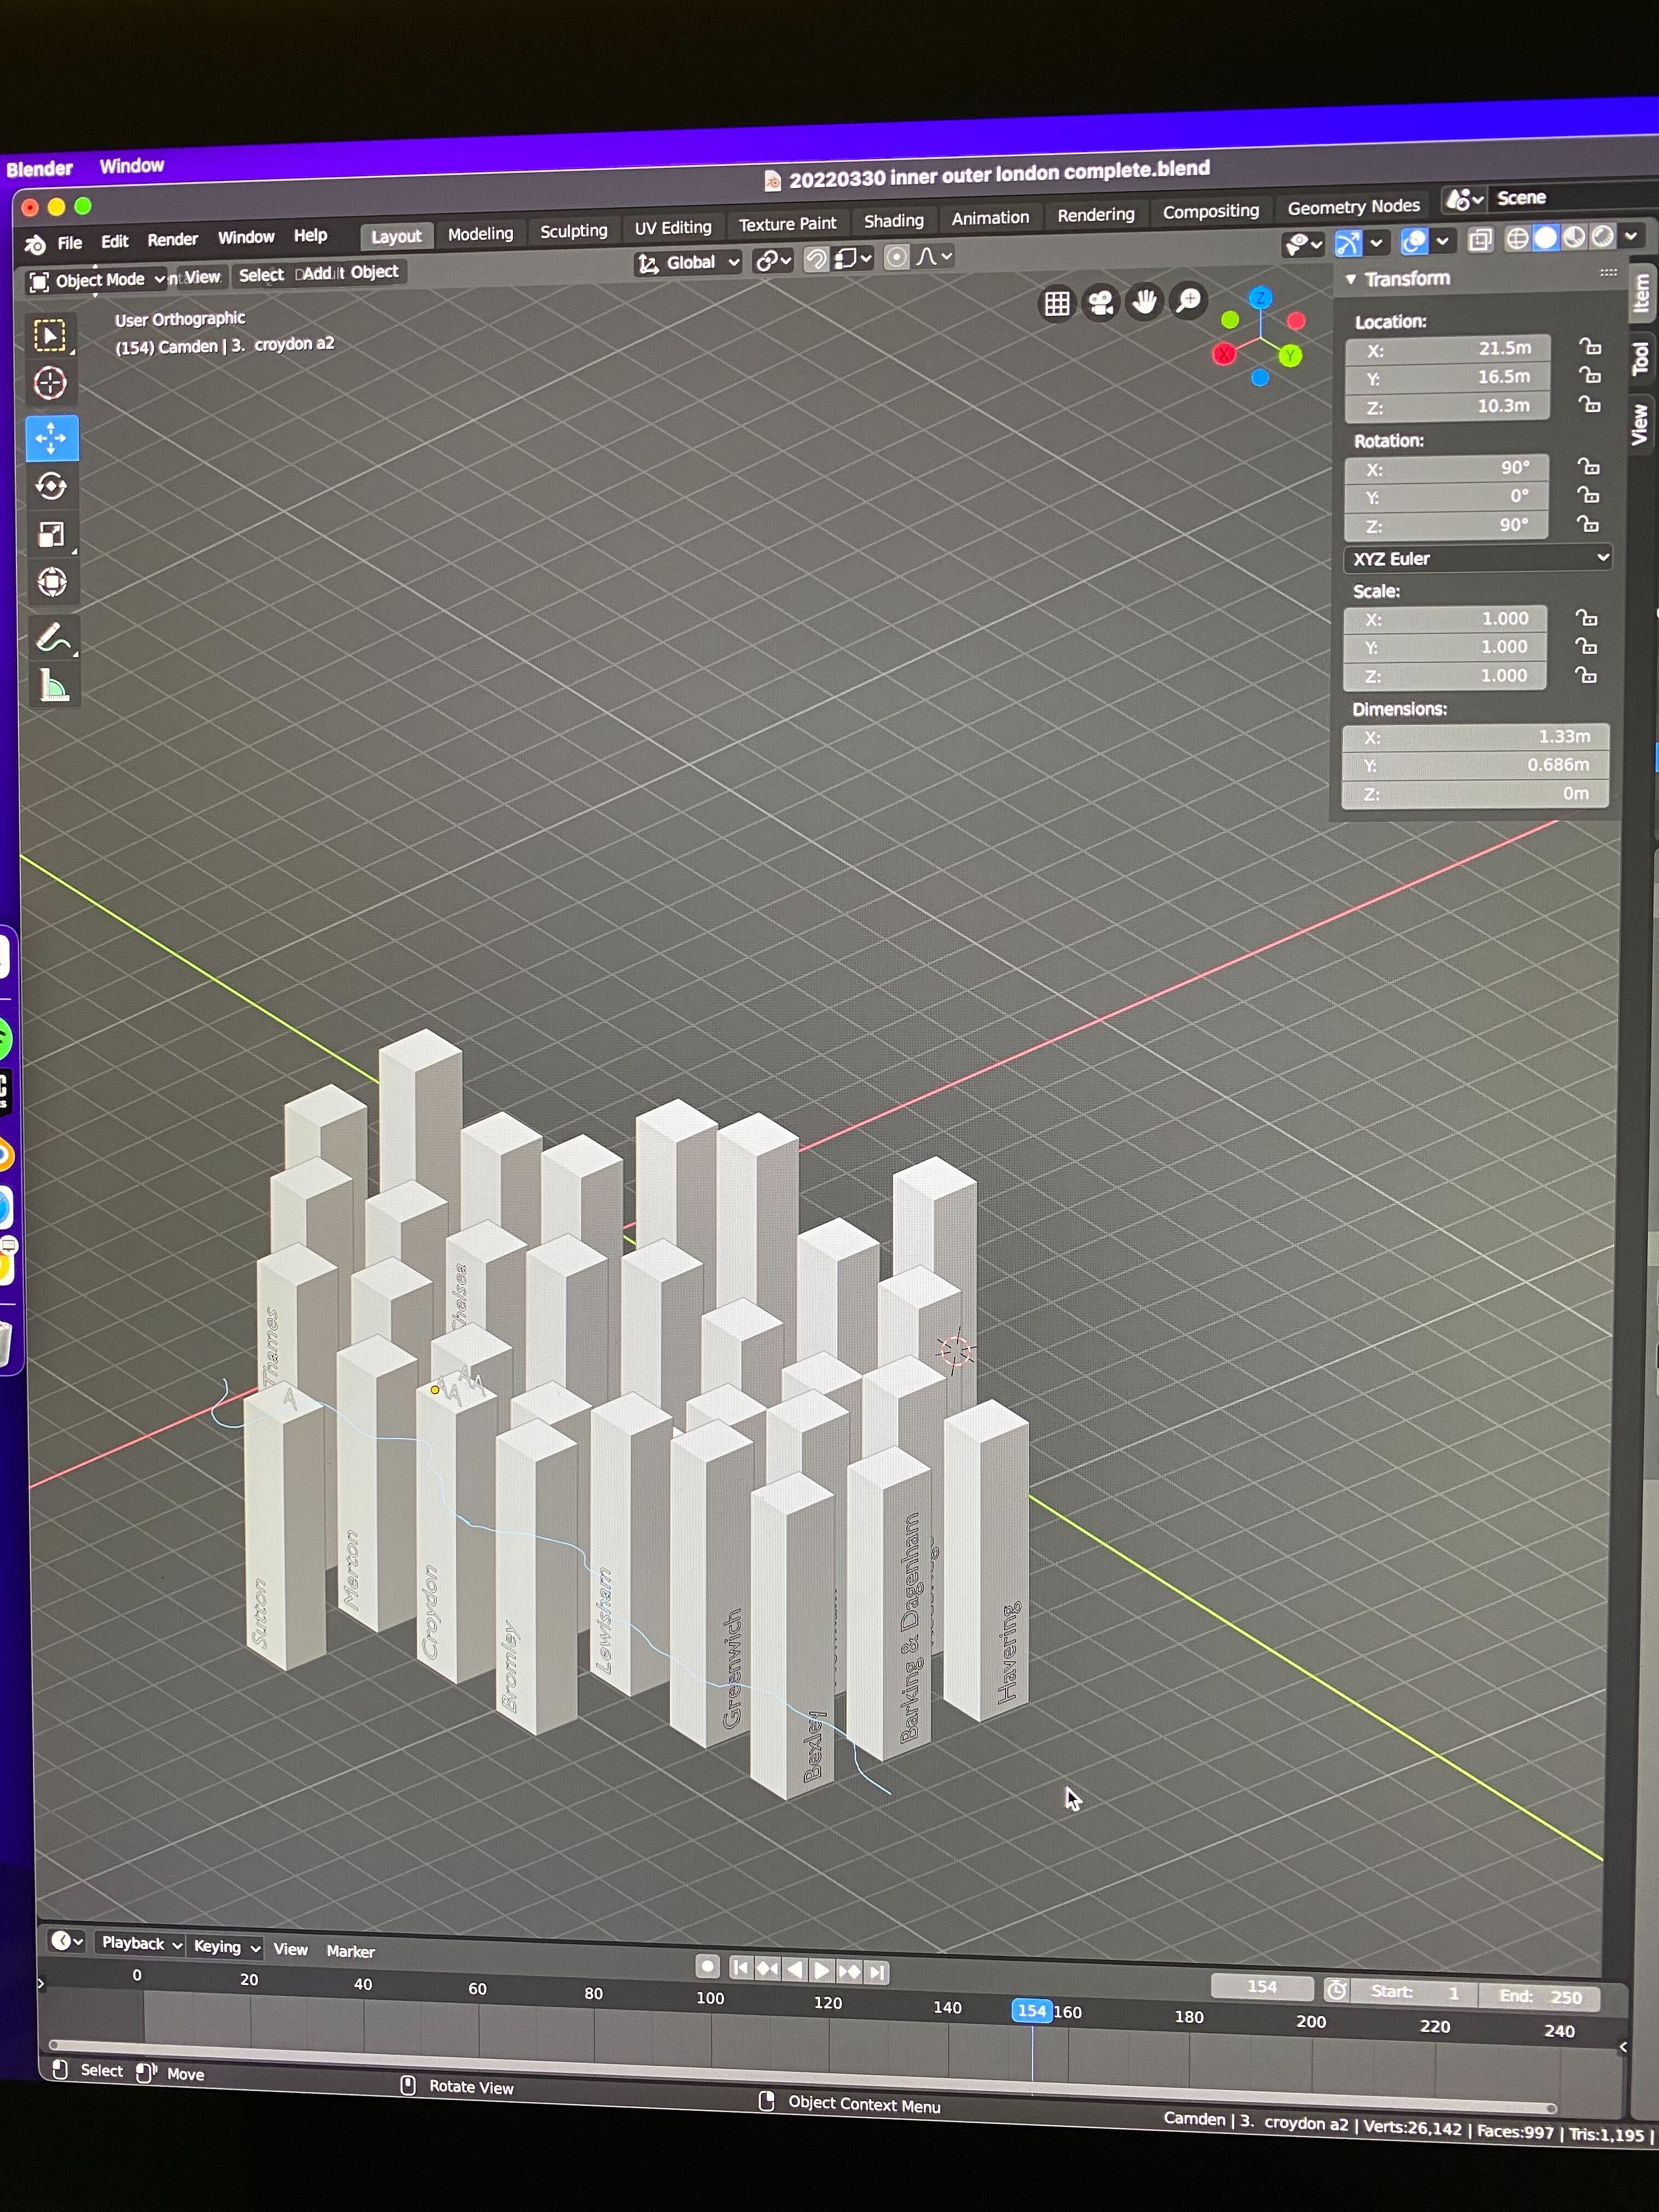
This project is ongoing: the next steps are to integrate socioeconomic data and find images to visually represent each borough on the surface of the shapes.
 Sign in with Wallet
Connect another wallet
Sign in with Wallet
Connect another wallet