# __GWFVIS - Wiki__ V1
## How to get started?
1. Login with your NSID – click on the top right icon at [GWF Vis](http://gwfvis.usask.ca/RiverFlow/).
1. Create a file by right clicking on the left panel directory labeled with your nsid.
1. A newly created file will already have some code written in it.
1. Execute the code by clicking the top right triangle icon. This will create a default layout for geographic visualization in a new tab as follows.
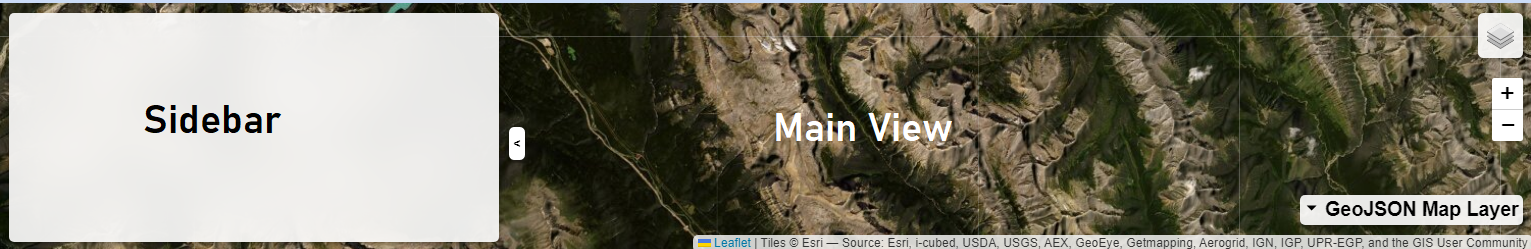
<!--img src="https://www.cs.usask.ca/faculty/dmondal/Presentations/pic/map.jpg"
alt="default map"
style="width: 600px; " /-->
## Understanding the default code.
1. Load the default vis configurations.
```py
import gwfvis
vis_config = gwfvis.load_vis_config()
```
The gwfvis api has been imported. A new variable `vis_config` has been initiated with default visualization configuration. We will now add new features to `vis_config` and then visualize it.
1. Add the default map layer
```py
gwfvis.add_plugin(vis_config, gwfvis.SATELITTE_LAYER)
```
To add a feature to `vis_config`, we use `gwfvis.add_plugin()` which takes three parameters.
- The `vis_config` itself
- The feature to be added. Here we are adding a `SATELLITE_LAYER`, which is already configured in gwfvis for convenience.
- [Optional] One of strings `'main'` and `'sidebar'`. This tells whether the user controls for this feature will be added to the main view or to the sidebar. Here we do not create user controls.
1. Set a view for the map
```py
vis_config['view'] = {
'center': [51.312588, -116.021118],
'zoom': 10
}
```
The string `'view'` is being configured to set the map center and zoom level
1. Show the visualization
```py
gwfvis.render(vis_config)
```
## How to add a new feature on the visualization?
A feature can be added by importing a plugin, configuring its properties and adding it to `vis_config`. Click [here](#All-current-provided-plugins) to see a list of plugins available.
#### Example: Creating a polygon layer on the map
1. A sample dataset `catchment.gwfvisdb` is being loaded from the datasets directory.
```py
dataURL = 'http://gwfvis.usask.ca/RiverFlow/api/file/fetch/public/datasets/catchment.gwfvisdb'
```
1. The plugin to create a polygon layer is `geojson-layer`, which has two properties: `layerName` to show on the map, and `dataSource` to read the data from.
```py
polygon_layer = {
'import': 'geojson-layer',
'props': {'layerName': 'Catchment', 'dataSource': dataURL}
}
```
1. Add the layer to `vis_config`.
```py
gwfvis.add_plugin(vis_config, polygon_layer)
```

_Go to [GWF Vis](http://gwfvis.usask.ca/RiverFlow/) and check the example file `polygons.py`._
Check out [config color schemes](#Config-color-schemes)
## How to add a legend for a polygon layer?
As the polygons are usually colored, adding a legend would be helpful to understand the colors.
#### Example: Adding a __legend__
1. A sample dataset `catchment.gwfvisdb` is being loaded from the datasets directory.
```py
dataURL = 'http://gwfvis.usask.ca/RiverFlow/api/file/fetch/public/datasets/catchment.gwfvisdb'
```
1. Define the __legend__
```py
legend = {
'import': 'legend',
'props': {
'dataSource': catchment_dataset
}
}
```
1. Add the __legend__ to `vis_config`
```py
gwfvis.add_plugin(vis_config, legend, 'main')
```
Check out [config color schemes](#Config-color-schemes)
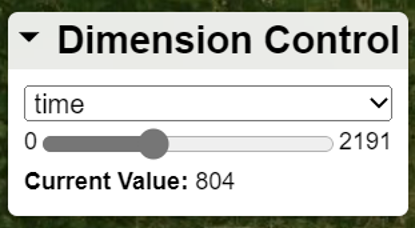
## How to add a series of data to the polygons (e.g., time series, soil depth, etc.)?
When the dataset contains dimensions, we can add add a __dimension control__ to the vis, which provides the ability to change any current dimension to a specific value. The __dimension control__ is imported as `dimension-control`. When you interact with the __dimension control__, the polygon layer would be updated.
#### Example: Creating a __dimension control__
1. Assume we have the dataset `catchment.gwfvisdb` loaded.
```py
dataURL = 'http://gwfvis.usask.ca/RiverFlow/api/file/fetch/public/datasets/catchment.gwfvisdb'
```
1. Define the __dimension control__.
```py
dimension_control = {
'import': 'dimension-control',
'props': {
'dataSource': dataURL
}
}
```
1. Add the __dimension_control__ to `vis_config`. In this case, we are adding it into the __main view__.
```py
gwfvis.add_plugin(vis_config, dimension_control, 'main')
```
_Go to [GWF Vis](http://gwfvis.usask.ca/RiverFlow/) and check the example file `dimension_control.py`._
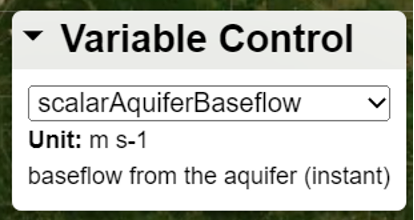
## How to add multiple variables to the polygons (e.g., SWE, Temp, etc.)?
When the dataset contains multiple, we can add add a variable control__ to the vis, which provides the ability to change the current variable. The __variable control__ is imported as `variable-control`. When you interact with the variable control__, the polygon layer would be updated.
#### Example: Creating a __variable control__
1. Assume we have the dataset `catchment.gwfvisdb` loaded.
```py
dataURL = 'http://gwfvis.usask.ca/RiverFlow/api/file/fetch/public/datasets/catchment.gwfvisdb'
```
1. Define the __variable control__.
```py
variable_control = {
'import': 'variable-control',
'props': {
'dataSource': dataURL
}
}
```
1. Add the __variable_control__ to `vis_config`. In this case, we are adding it into the __main view__.
```py
gwfvis.add_plugin(vis_config, variable_control, 'main')
```
_Go to [GWF Vis](http://gwfvis.usask.ca/RiverFlow/) and check the example file `variable_control.py`._
## How to visualize polygon information (metadata) to the sidebar?
There could be some information (metadata) for each polygon, which we can add a __metadata viewer__ to the vis. The __metadata viewer__ is imported as `metadata`. The metadata of current selected polygon, variable, and dimension would be shown.
#### Example: Creating a __metadata viewer__
1. Define the __metadata viewer__.
```py
metadata = {
"import": "metadata"
}
```
1. Add the __metadata viewer__ to `vis_config`. In this case, we are adding it into the __sidebar__.
```py
gwfvis.add_plugin(vis_config, metadata, 'sidebar')
```
_Go to [GWF Vis](http://gwfvis.usask.ca/RiverFlow/) and check the example file `metadata.py`._
## How to pin polygons?
When you want to pin some locations, you can add a __user selection control__.
#### Example: Creating a __user selection control__
1. Define the __user selection control__. The `slot` of `"top"` is a property of the __sidebar__ container, which would display this plugin on the top and being not srollable.
```py
user_selection = {
"import": "user-selection",
"containerProps": {
"slot": "top"
}
}
```
1. Add the __user selection control__ to `vis_config`. In this case, we are adding it into the __sidebar__.
```py
gwfvis.add_plugin(vis_config, user_selection, 'sidebar')
```
_Go to [GWF Vis](http://gwfvis.usask.ca/RiverFlow/) and check the example file `user_selection.py`._
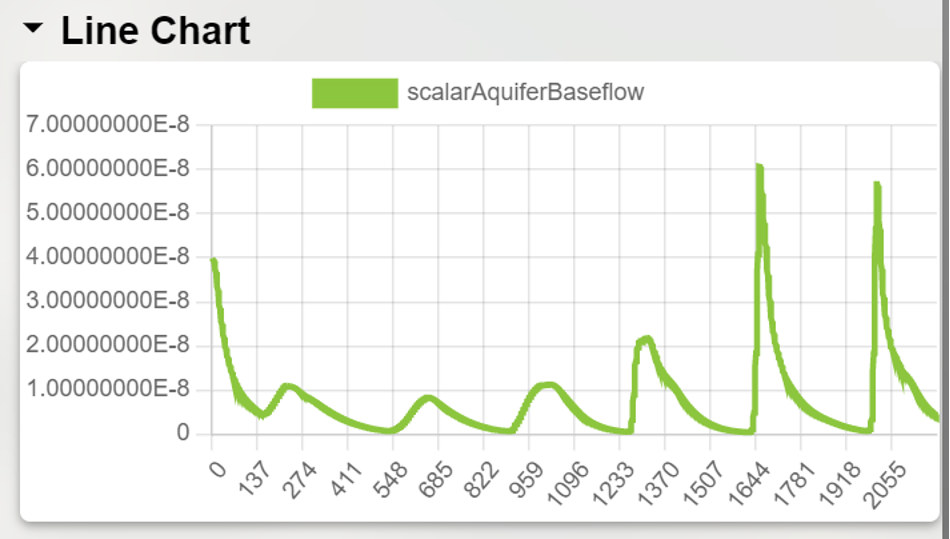
## How to add a chart (e.g., line chart, rader chart)?
When we want to see some statistics, we can add some charts into the vis.
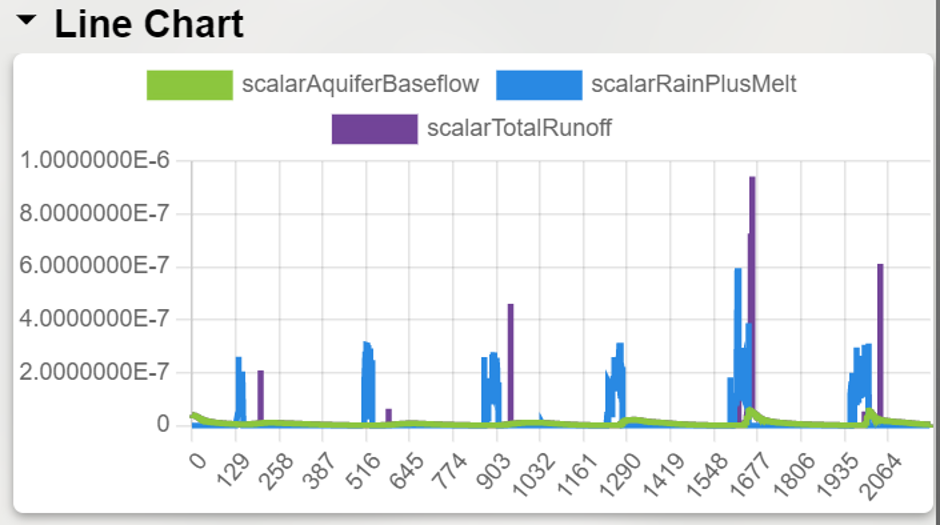
#### Example: Creating a __line chart__
1. Define the __line chart__. We assume there is a dimension called `time`. In this case, the chart shows information of current selected polygon and variable.
```py
line_chart = {
"import": "line-chart",
"props": {
"dimension": "time"
}
}
```
__Not sure if we need to give this level of details as below__
If you want to always show information about specific variables, you can configure it as below:
```py
line_chart = {
"import": "line-chart",
"props": {
"variableNames": ["scalarAquiferBaseflow", "scalarRainPlusMelt", "scalarTotalRunoff"],
"dimension": "time"
}
}
```
1. Add the __line chart__ to `vis_config`. In this case, we are adding it into the __sidebar__.
```py
gwfvis.add_plugin(vis_config, line_chart, 'sidebar')
```
_Go to [GWF Vis](http://gwfvis.usask.ca/RiverFlow/) and check the example file `line_chart.py`._
Check out [some advanced interactions for the line chart](#Advanced-interactions-for-the-line-chart)
#### Example: Creating a __radar chart__
1. Define the __radar chart__. In this case, the chart shows information of current selected polygon, variable, and dimension values.
```py
radar_chart = {
"import": "radar-chart"
}
```
1. Add the __radar chart__ to `vis_config`. In this case, we are adding it into the __sidebar__.
```py
gwfvis.add_plugin(vis_config, radar_chart, 'sidebar')
```
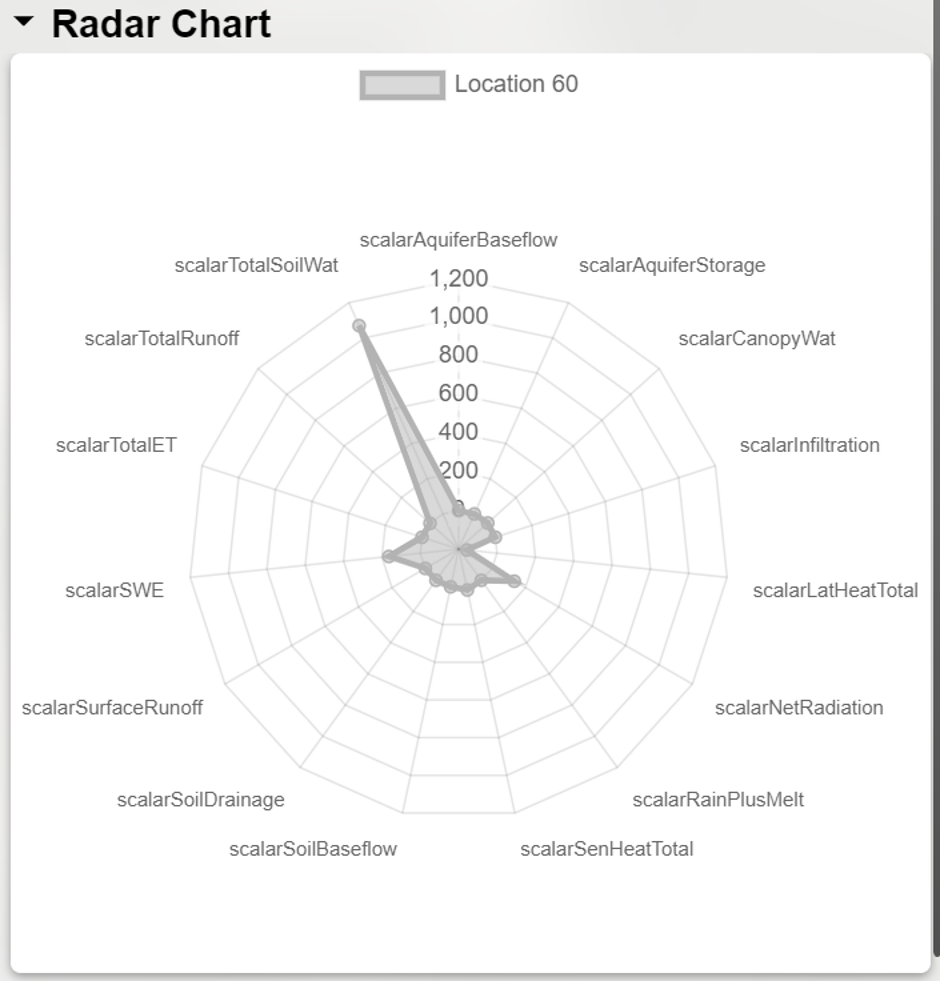
The __radar chart__ would show the current selected location as well as all pinned locations.
_Go to [GWF Vis](http://gwfvis.usask.ca/RiverFlow/) and check the example file `radar_chart.py`._
## How to create a `.gwfvisdb` database from csv, shapefiles, or netCDF
- You can transform your data into a `.gwfvisdb` database and upload in the data directory
- Python scripts for this will be prvided in the future
# Appendix
## All current provided plugins
- _data-fetcher_
- tile-layer
- geojson-layer
- user-selection
- metadata
- line-chart
- radar-chart
- dimension-control
- variable-control
- legend
## Using `numpy` and `pyplot`
We provide `numpy` and `matplotlib.pyplot`, which gives you the ability of plotting your own charts within the programmable interface.
Let us get started with a simple code snippet (,which is obtained from [here](https://queirozf.com/entries/matplotlib-pyplot-by-example#change-figure-size)).
```py
import numpy as np
import matplotlib.pyplot as plt
x = np.linspace(0.0,100,50)
y = np.random.uniform(low=0,high=10,size=50)
plt.scatter(x,y)
# get reference to the current figure
fig = plt.gcf()
fig.set_size_inches(8,3)
plt.show()
```
If you run the above code snippet, it would generate a scatter plot for you. By following below steps, you can show it directly in the programmbale interface.
1. Add import of `gwfvis`.
```py
import gwfvis
```
1. Replace `plot.show()` to `gwfvis.render_pyplot_figure()`.
That is it. Then we get the code like this:
```py
import numpy as np
import matplotlib.pyplot as plt
import gwfvis
x = np.linspace(0.0,100,50)
y = np.random.uniform(low=0,high=10,size=50)
plt.scatter(x,y)
# get reference to the current figure
fig = plt.gcf()
fig.set_size_inches(8,3)
gwfvis.render_pyplot_figure()
```
Now, if you click on the triangle button on the upper-right corner, your plot would be shown in the programmable interface.
_Go to [GWF Vis](http://gwfvis.usask.ca/RiverFlow/) and check the example file `pyplot.py`._
## Advanced interactions for the line chart
### Checking specific values
When you hover your mouse to the lines, a tooltip of its specific value would be shown.
### Axis zooming in/out and panning
When you move your mouse to axes of the line charts, you are able you drag to pan and scroll to zoom in/out. To prevent interrupt the normal scroll flow, to make a axis zooming, you need to hold `Ctrl` button and then scroll. If you are using a touch pad, you could just pinch over the axes to zoom in/out.
### Jumping to specific dimension value
As the `x` axis stands for the dimension, we might find some interesting position across the axis. When you checking the specific values, you can click it, which would navigate the dimension to the selected value (same effect as you drag the bar of the __dimension control__).
### Disable a line
When showing multiple lines, you can click a legend item to disable the coresponding line.
## Config color schemes
We provide the ability of change color scheme for the GeoJSON layer and the legend. To do so, we need to pass a `colorScheme` value to the config.
Assume we have a config of GeoJSON layer like below:
```py
{
...
'props': {
'layerName': 'Catchment',
'dataSource': dataURL
}
}
```
If we want to add a custom color scheme, we should add the `colorScheme`:
```py
{
...
'props': {
'layerName': 'Catchment',
'dataSource': dataURL,
'colorScheme': {
'': {
'type': 'custom',
'scheme': ['blue', 'green', 'yellow', 'red']
}
}
}
}
```
This would change the color scheme to a color gradient of `['blue', 'green', 'yellow', 'red']`. In this example, the key `''` stands for all variables. We could also change color schemes for different variables:
```py
{
...
'props': {
'layerName': 'Catchment',
'dataSource': dataURL,
'colorScheme': {
'': {
'type': 'predefined',
'scheme': 'blue-red'
},
'scalarSWE': {
'type': 'custom',
'scheme': ['blue', 'green', 'yellow', 'red']
}
}
}
}
```
Assuming `scalarSWE` is a variable name. In this case, `scalarSWE` variable would have the color scheme of a color gradient of `['blue', 'green', 'yellow', 'red']` and all other varibales would have the build-in `blue-red` color scheme.
If you also uses a __legend__, you should pass the same `colorScheme` dict to `props` of the __legend__.
 Sign in with Wallet
Connect another wallet
Sign in with Wallet
Connect another wallet