---
tags: ironhack, lecture,
---
<style>
.markdown-body img[src$=".png"] {background-color:transparent;}
.alert-info.lecture,
.alert-success.lecture,
.alert-warning.lecture,
.alert-danger.lecture {
box-shadow:0 0 0 .5em rgba(64, 96, 85, 0.4); margin-top:20px;margin-bottom:20px;
position:relative;
ddisplay:none;
}
.alert-info.lecture:before,
.alert-success.lecture:before,
.alert-warning.lecture:before,
.alert-danger.lecture:before {
content:"👨🏫\A"; white-space:pre-line;
display:block;margin-bottom:.5em;
/*position:absolute; right:0; top:0;
margin:3px;margin-right:7px;*/
}
b {
--color:yellow;
font-weight:500;
background:var(--color); box-shadow:0 0 0 .35em var(--color),0 0 0 .35em;
}
.skip {
opacity:.4;
}
</style>

# JS | Debugging, Error Handling and JS Hint
## Learning Goals
After this lesson, you should be able to:
- Understand what *debugging* is
- Correctly use the `console` object
- Use a debugging tool to handle the errors
- Use breakpoints, `watch` and `call stack`
- Access variables and their behavior during execution time
- Use execution time controls
- Identify the most common errors in JavaScript
- Understand what **JS Hint** is and how it works
## Debugging
:::info lecture
:::
:::info
*[Debugging](https://en.wikipedia.org/wiki/Debugging) is a multi-step process that involves identifying a problem, isolating the source of the problem, and then either correcting the problem or determining a way to work around it.*
:::
The final step of debugging is to test the correction or workaround and make sure it works.
In this lesson, we are going to teach you how to face errors, identify them, and fix them.
Also, at the end of the lesson, we will take a look at some of the most common errors in JavaScript, how to detect them and how to solve them.
## The _JavaScript Console_ tool
The **Chrome Dev Tools** offer us several tools to develop web applications, but one of the most useful features is the _JavaScript Console_.
The _JavaScript Console_ is a logger and a [command line interface](https://en.wikipedia.org/wiki/Command-line_interface). It allows us to easily interact with our apps, run JavaScript commands and display messages for debugging help.
:open_file_folder: We can bring up the console by simply opening the *Developers tools* (`Cmd + Alt + i` on Mac and `Ctrl + Shift + i` on PC) inside Chrome and clicking on the _Console_ tab.

### Using the console
The console could be used as [REPL](https://en.wikipedia.org/wiki/Read%E2%80%93eval%E2%80%93print_loop): We can write and execute code immediately. Let's try it, write some code in the prompt and press the *Enter* (`return`) key. The code will be interpreted and the output will be shown.

### The `console` object
We can also interact with the console to debug our code. The quickest way to do that is by using the [`console` object](https://developer.mozilla.org/en/docs/Web/API/console).
The `console` object enables us to use many different features, such as: printing values, clearing the console, throwing errors, and logging the current time.
#### How to use: `console.log`
We have been using the `console.log` method since the very beginning, so we are already familiar with it at this point. The `console.log` method allows us to print values into the JavaScript console. By printing values at different points in your code, you can inspect its behavior.
:::warning
:warning: Note that `console.log` **displays the parameters**, but **returns `undefined`**.
:::

## Debugging in the browser
To follow the rest of this lesson, **clone this repo**:
:::info lecture
Clonons ce repo :
:::
```bash
$ git clone https://github.com/Ironhack-Paris-PTWD-September-2019/lab-javascript-debugging-error-and-js-hint
```
:::info lecture
Et ouvrons le fichier `index.html` avec devTools.
:::
### The Chrome DevTools debugger
:::info lecture
Présentation des différents onglets de devTools...
:::
:::info
Chrome DevTools is a set of web developer tools built directly into the Google Chrome browser. DevTools can help you edit pages on-the-fly and diagnose problems quickly, which ultimately helps you build better websites, faster.
:::
The DevTools include gadgets organized in panels or tabs:
* **Elements**: HTML DOM & CSS Styles
* **Console**: JavaScript REPL
* **Network**: Inspect Network requests
* **Profiles**: Performance monitoring by inspecting the memory use of our application
* **Application**: Access to the browser services (LocalStorage, cookies, Cache Storage, Service Workers, etc.)
* **Timeline**: Records how our page loads in time
* **Sources**: All resources of a page (HTML, CSS, JavaScripts, images, etc.)
:::info lecture
Montrer que l'on peut également ré-organiser les onglets
:::
### The Sources Tab
:::info lecture
Affiche toutes les ressources de la page.
:::
Another useful tool that Chrome DevTools offer us is the Sources Tab. In this section, you will be able to inspect the files loaded in your web app, either local or external and explore them to debug and optimize your code.

Load the files in your cloned project by opening the `index.html` in Google Chrome. Open the DevTools and inspect in the **Sources tab** the HTML, CSS and JavaScript files.
The Sources tab lets us inspect the files we are executing. DevTools have some functionality that will help us to identify and fix errors.
:::info lecture
Peut éventuellement fonctionner également comme un éditeur.
:::
### Errors displayed in `console`
:::info lecture
Si des erreurs se produisent, c'est dans la console que nous pourrons les voir. D'ailleurs, nous en avons une !
:::
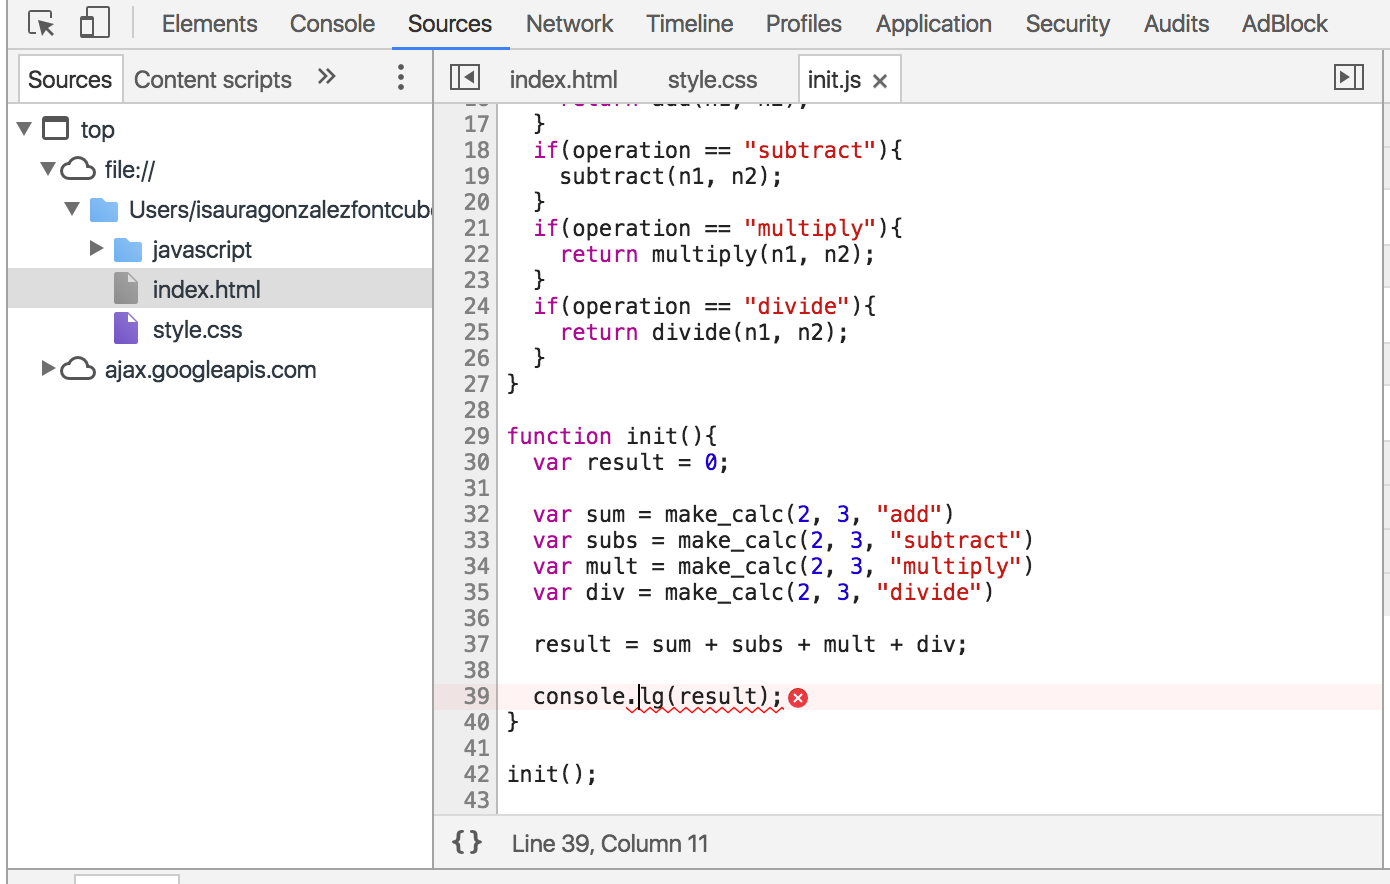
When there's an error while our script is executing, the console will show us the error:

If we take a closer look, we can see at least 2 elements in every error:
:::info lecture
Prenons le temps de lire les erreurs, elles sont rouges et piquent les yeux mais ce sont nos amies :
:::
:::success
- The **error exception:**`Uncaught TypeError: console.lg is not a function(…)` is **what** happens
- The location **where** it happened: `init.js:39`, the file and line number where the error exception was thrown.
:::
:::info
:bulb: Detecting, reading and troubleshooting are all very important skills. Try to read errors carefully and we guarantee that in some errors you'll find at least a half of the solution. Knowing how to read the errors will boost your learning process greatly.
:::
We can troubleshoot this error by clicking on the location. It will act as a link and redirect us to the *Sources Tab*, where the error will be shown at the exact location.
- **Click on the location to display the file**
:::info lecture
En cliquant sur `init.js:39` on accède à la ressource concernée dans l'onglet Sources :
:::
### Execution control: Breakpoints
:::info lecture
Dans notre cas, l'erreur s'agit d'une typo, très facilment corrigeable. Mais quid si l'erreur venait du fonctionnement interne de notre programme : par ex que nous multipliions un nombre par une chaine produisant `NaN` ? Comment pourrions nous "traquer" les valeurs internes à notre programme ?
:::
:::info lecture
Bien sûr nous pouvons faire plein de `console.log`, et ce sera une vraie solution de secours !
:::
In the previous example, we can easily confirm this as a typo in a `console.log()` call. But what happens if the error is not so obvious? For example: **an error in a built-in JavaScript function**, or **a variable with an `undefined` value.**
In our example, our `console.log` of the `result` variable gives us `NaN` (Not a Number). If we wanted to figure out why we have to do some detective work.
Testing a variable's value by using a lot of `console.log` calls is not efficient. The Chrome DevTools provide [Breakpoints](https://developers.google.com/web/tools/chrome-devtools/javascript/add-breakpoints) to inspect the status of a variable in a particular time of the execution.
:::info lecture
Mais en plus des `console.log` nous allons pouvoir interrompre le programme à une certaine ligne : le mettre en pause et regarder ce qu'il se passe.
:::
:::info lecture
Ce sont les breakpoints !
NB : Attention c'est le meme mot qu'en CSS :)
:::
:::info
:bulb: **Breakpoints** are like flags placed in our JavaScript code that allow us to stop the execution once we are in a particular line.
:::
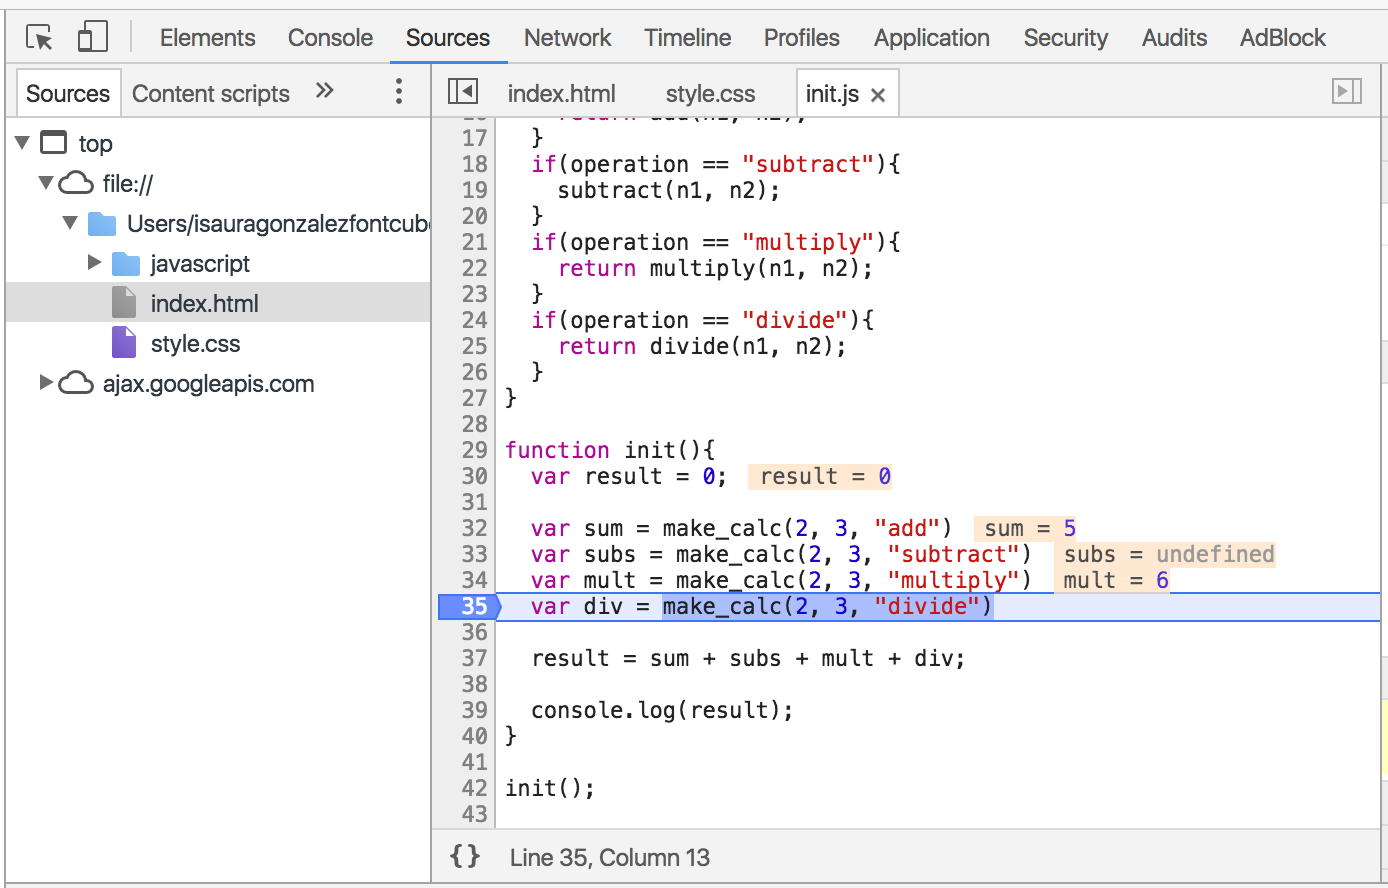
Let's add a breakpoint after the multiplication by selecting the *Sources* tab and clicking on the 35th line. This will stop the execution right in that point:
:::info lecture
Définissons un breakpoint L35 et rechargeons :
:::

When the execution is stopped, use the console to get the value of `sum` and `result`. What happens?
:::info lecture
La page est en pause ! Nous pouvons maintenant inspecter les valeurs de nos différentes variables à ce moment suspendu :
:::
```javascript
console.log(sum);
console.log(result);
```
In the code panel you can see the value of the variables at that point (notice the `div` variable doesn't exist yet):
:::info lecture
Le point d'arret met en pause le programme AVANT l'exécution de la ligne : ici, la variable `div` n'est pas encore assignée.
:::
:::info
:bulb: Execution is always stopped **right before** running the line where the breakpoint is.
:::
#### The execution control panel
:::info lecture
Faire pause est super, mais nous pouvons faire encore mieux :) Nous allons pouvoir "avancer" dans notre programme et continuer la lecture pas-à-pas...
:::
The DevTools debugger has a control panel that allows us to control how the execution continues. We can continue the execution after the breakpoint, skip a little ahead after the breakpoint or step into a function call.

:::info lecture
Détailler chq control :
:::
-  **RESUME**: Resumes execution up to the next breakpoint. If no breakpoint is encountered, normal execution is resumed.
-  **STEP OVER:** Executes whatever happens on the current line and jumps to the next line.
-  **STEP INTO:** If the next line contains a function call, _Step Into_ will jump to and pause that function at its first line.
-  **STEP OUT:** Executes the remainder of the current function and then pauses at the next statement after the function call.
-  **DEACTIVATE BREAKPOINTS**: Temporarily disables all breakpoints. Use to resume full execution without actually removing your breakpoints. Click it again to reactivate the breakpoints.
### Execution control: Watch
:::info lecture
On peut même `watch`er des variables en particulier !
:::
Chrome DevTools allow you to easily see multiple variables throughout your application. The *Sources* tab allows you to [watch variables](https://developers.google.com/web/tools/chrome-devtools/javascript/watch-variables) within your application.

By taking advantage of this functionality we can remove all of our `console.log` calls.
#### Adding variables
To add a variable to the watch list, use the **+** icon to the right of the section heading. This will open an inline input where you should provide the variable name you want to watch.
**The watcher will show you the current value of the variable as it is added**.
:::success
:+1: If you remove all the breakpoints we had before, add a break point to any of the functions and add the variables `n1` and `n2` to **Watch** you will see the values of variables. You can inspect the objects and arrays as if you were in the console.
:::
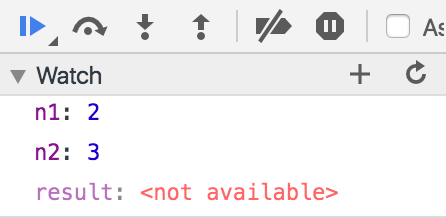
:::info
:information_source: If the variable is not set or can't be found during the execution it will show `Not Available` as value.
:::
:::info lecture
Si une variable "watchée" n'est pas disponible à ce moment dans le programme, on aura `<not available>` :
:::
📝 **Time to practice**
:::info lecture
<span style="font-size:500%">🏋🏽♀️</span>
Watchez `sum` et `subs` et définissez un point d'arrêt pour voir leurs valeurs.
:::
Add `sum` and `subs` to your _Watch_ list and make a breakpoint in the correct place to see their values.
### Execution control: Call Stack
:::info
The **`Call Stack`** is a *Chrome Dev Tools* functionality that allows us to trace the history of a function call.
:::
:::info lecture
En JavaScript, on a déjà vu qu'une fonction pouvait appeler une autre fonction, par ex:
```javascript
function c() {
return Math.random();
}
function b() {
return c();
}
function a() {
...
var res = b();
}
```
`a > b > c`
:::
In JavaScript, `function a` can call `function b`, and `function b` can call `function c`. When `function c` returns, it will return to the context of `function b` and so on.
Sometimes when we are debugging and we place a breakpoint in our code, it's useful to know which function called the current function we are executing.
:::info
:bulb: The [Call Stack](https://en.wikipedia.org/wiki/Call_stack) is an internal data structure that keeps track of the active functions in a program.
:::
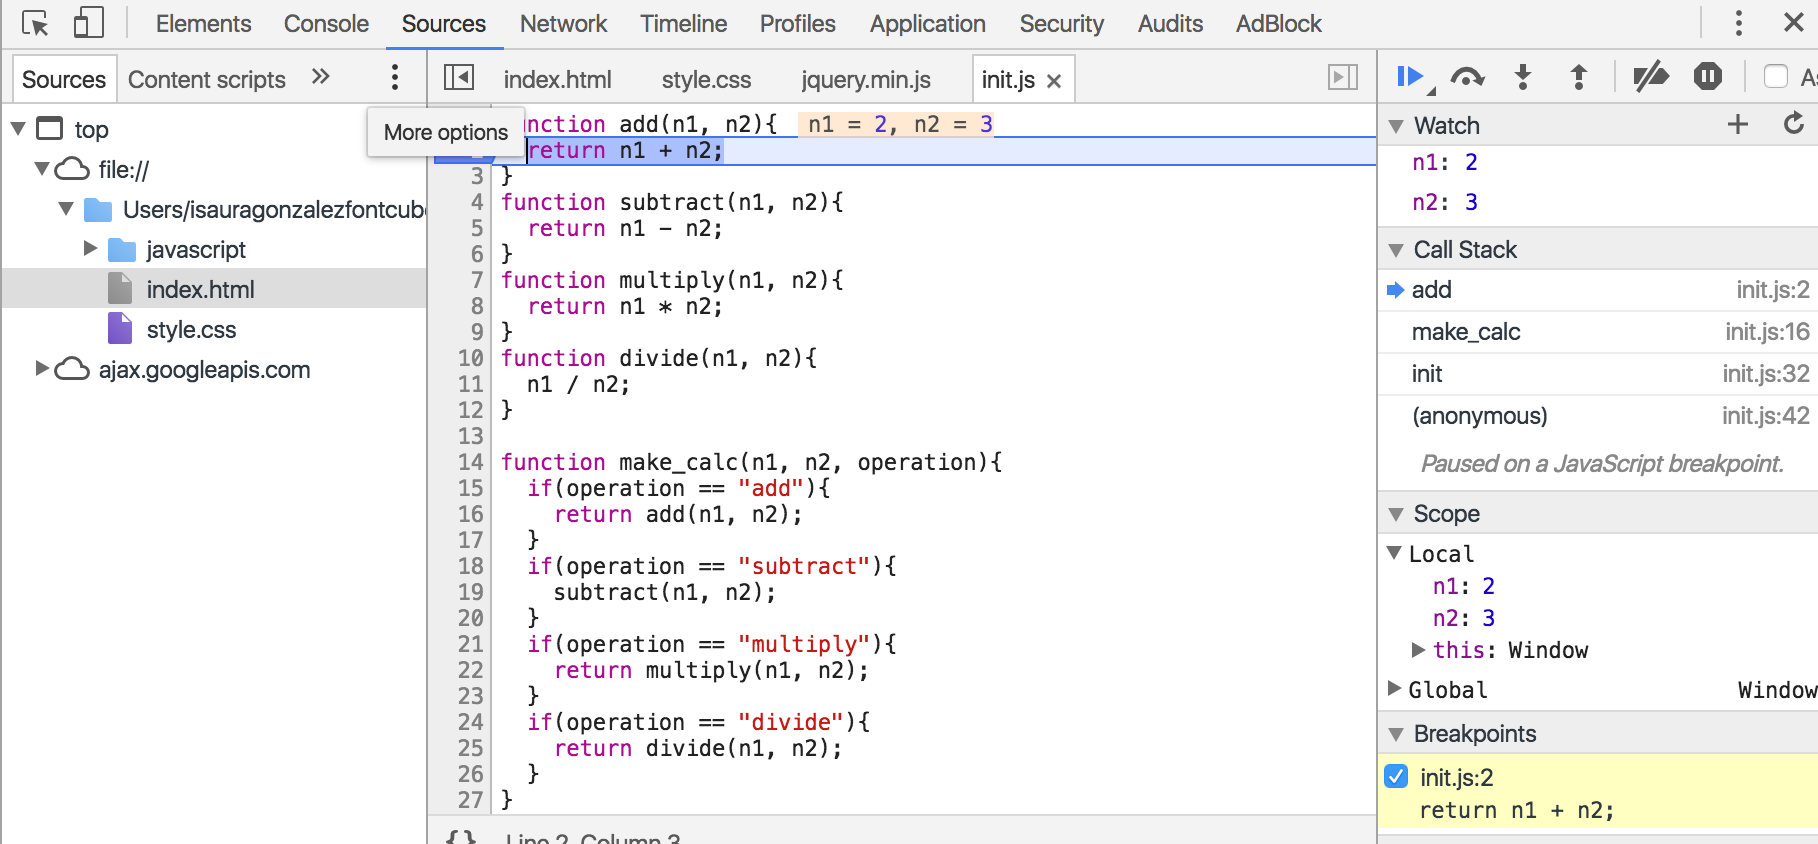
As an example, let's place a `break point` inside the `function add` and execute the code.
Once this `break point` stops the execution, we can see in the `Call Stack` section the line where the function was called and the function who called it, along with the line where that happened.
:::info
Ce va etre le cas de notre fonction `add` qui va être appelée. Définissons un breakpoint à l'intérieur de `add` :
:::
```javascript
function add(n1, n2){
return n1 + n2;
}
function make_calc(n1, n2, operation){
if(operation == "add"){
return add(n1, n2);
}
}
function init(){
var result = make_calc(2, 3, "add");
console.log(result);
}
init();
```
When we try to execute this piece of code, the result is going to be printed once the operation is set and the calculation is made and returned. Let's see the trace of the `add` function:

We can see in the `Call Stack` how the trace is made from the last function (`add`) until the very first (`init`).
:::info lecture
On voit ici la pile des appels :
:::
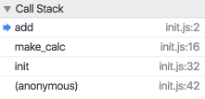
:::info lecture
On peut d'ailleurs cliquer sur un des éléments de la pile pour remonter jusqu'à l'instruction responsable de cet appel.
:::
## Try... Catch Statement
:::info lecture
Les erreurs nous aide à détecter nos propres erreurs de programmation. Par ex si nous tentons d'accéder à une variable qui n'existe pas.
:::
:::info lecture
Cependant, parfois, nous allons vouloir "gérer" certaines erreurs prévues... sans que notre programme ne cesse pour autant de fonctionner.
:::
The [try ... catch](https://developer.mozilla.org/en-US/docs/Web/JavaScript/Reference/Statements/try...catch) statement executes a piece of JavaScript code to `try`.
If any of the specified errors are thrown, the `catch` block created for that error would be executed instead.
```javascript
try {
myroutine();
} catch (error) {
...
logMyErrors(error);
} finally {
...
}
```
- **Try:** the statement to be executed
- **Catch:** the statement that is executed if an exception is thrown in the try block.
- **Exception_var (`error`):** an identifier to hold an exception object for the associated catch clause.
- **Finally_statements (OPTIONAL):** statements that are executed after the try statement completes. These statements execute regardless of whether or not an exception was thrown or caught.
Trying to execute this code, we will see the generated output in the console:
:::info lecture
Un autre ex:
```javascript
function str2obj(texte) {
return JSON.parse(texte); // peut "lever" une erreur
}
```

```javascript
var sac = [];
try {
sac.push(str2obj('coucou')); // levera une exception
} catch(e) {
console.log("Cet objet n'est pas valide.")
}
console.log(sac);
```
et même:
```javascript
var sac = [];
['coucou', '{"type": "livre"}'].forEach(function (el) {
try {
sac.push(str2obj(el))
} catch(e) {
console.log(el, "n'est pas un objet valide")
}
})
console.log(sac);
```
:::
```javascript=
function powerOf3 (num) {
return number ** 3;
}
try {
powerOfThree(9);
} catch (error) {
console.log("Gets executed if there's an error.");
console.log(error);
} finally {
console.log("Gets executed at the end no matter what.");
}
```
You can see how there's a typo with the `num` variable on **line 2**. This causes a `ReferenceError`. Since we are `catching` the errors, we can choose how to handle the error instead of displaying the predefined error that stops the execution of the app.
A `catch` clause contains statements that specify what to do if an exception is thrown in the try block. That is, you want the try block to succeed, and if it doesn't succeed, you want the control to pass to the catch block.
If any statement within the try block (or in a function called from within the try block) throws an exception, control immediately shifts to the catch clause. If no exception is thrown in the try block, the catch clause is skipped.
The `finally` clause executes after the try block and catch clause(s) execute but before the statements following the try statement. It always executes, regardless of whether or not an exception was thrown or caught.
### Exceptions types
:::info lecture
Différentes erreurs en JS :
:::
These are the primary exceptions for JavaScript:
- **RangeError:** Raised when a numeric variable exceeds its allowed range.
```javascript
var goodArray = new Array(3);
console.log(goodArray);
// No error => [undefined × 3]
var badArray = new Array(-1);
// Error => Uncaught RangeError: Invalid array length(…)
```
- **ReferenceError:** Raised when an invalid reference is used.
```javascript
var name = "Ted";
console.log(nme);
// Uncaught ReferenceError: nme is not defined
```
- **SyntaxError:** Raised when a syntax error occurs while parsing JavaScript code.
```javascript
function doSomething(){
console.log("I'm doing something!);
// Uncaught SyntaxError: Unexpected end of input
```
- **TypeError:** Raised when the type of a variable is not as expected.
```javascript
var name = "Bob";
// (toFixed is a method for numbers)
name.toFixed();
// Uncaught TypeError: name.toFixed is not a function
```
- **URIError:** Raised when the encodeURI() or decodeURI() functions are used in an incorrect manner.
```javascript
decodeURI("http:/google.com%")
// Uncaught URIError: URI malformed(…)
```
- **EvalError:** Raised when the eval() function is used in an incorrect manner.
### Throw errors
:::info lecture
Nous pouvons nous aussi dans nos programmes lever des erreurs grâce à l'opérateur `throw` :
```javascript
throw new Error("Mon message d'erreur");
```
Attention cependant car throw arrêtera le programme s'il n'est pas exécuté dans un `try {} catch() {}`
:::
When an error occurs, JavaScript will normally stop and generate an error message. The technical term for this is: **JavaScript will throw an exception (throw an error)**. The `throw` statement allows you to create a custom error.
:::info
JavaScript will actually create an Error object with two properties: name and message.
:::
We recomend using `throw` together with try and catch, so you can control program flow and generate custom error messages.
```javascript=
function getUserName (user) {
if (!user.name) {
throw new SyntaxError("Incomplete data: no name");
}
return user.name;
}
try {
getUserName({name: "Raul", lastName:"Lopez"});
} catch (error) {
console.log("Gets executed if there's an error.");
console.log(error);
} finally {
console.log("Gets executed at the end no matter what.");
}
```
## JS Hint
:::info
[JSHint](https://jshint.com/) is a tool used for analyzing JavaScript source code and warns about quality problems.
:::
To use it, we suggest just simply visiting [https://jshint.com/](https://jshint.com/) and paste your code there.
Also you should add *jshint* extension in your VS Code editor.
Later, in the second module, you can install the [node-jshint](https://github.com/jshint/jshint) npm package - we will talk about that later on.
As the main takeaway, we encourage you to check your code as often as possible on the official *jshint* website since you will save yourself a lot of time when debugging.
If you would like to know more about JSHint, check out this [page](https://github.com/dwyl/learn-jshint).
## Debug Examples
#### Your turn
:::info lecture
<span style="font-size:500%">🏋🏽♀️</span>
A l'aide de devTools, débugguez le programme jusqu'à ce qu'il affiche en console le bon résultat de l'opération.
:::
::: info
As you might notice, the *calculatorApp* you cloned before has a lot of errors.
Remember to use all the tools that **Chrome Dev Tools** provide, and check if everything is working once you've fixed the error.
The app should display the sum of the results of the four operations.
:::
## Summary
In this lesson, we learned how the **Chrome Dev Tools** work. Its features are:
- **The `console`**
- `console.log`
- Error stack trace
- **Sources**
- `Break Points` - To stop the execution of your app at any certain line.
- `Watch` - For variables to have their value at any moment
- `Call Stack` - For functions to trace their execution path
- **Try... catch**
- **Throw**
- **JS Hint**
Debugging is one of the most important skills you will gain out of this course. Quick debugging and following errors is *vital* to your efficiency as a developer.
These are just tools. But these processes will take significant time and practice... and as a junior developer you will get a *ton* of debugging experience :)
:::success
:thumbsup: **Remember to read the information contained in the errors!**
:::
## Extra Resources
- [Chrome Dev Tools - Code School](http://discover-devtools.codeschool.com/)
- [learn-jshint](https://github.com/dwyl/learn-jshint)