---
tags: ironhack, lecture,
---
<style>
.markdown-body img[src$=".png"] {background-color:transparent;}
.alert-info.lecture,
.alert-success.lecture,
.alert-warning.lecture,
.alert-danger.lecture {
box-shadow:0 0 0 .5em rgba(64, 96, 85, 0.4); margin-top:20px;margin-bottom:20px;
position:relative;
ddisplay:none;
}
.alert-info.lecture:before,
.alert-success.lecture:before,
.alert-warning.lecture:before,
.alert-danger.lecture:before {
content:"👨🏫\A"; white-space:pre-line;
display:block;margin-bottom:.5em;
/*position:absolute; right:0; top:0;
margin:3px;margin-right:7px;*/
}
b {
--color:yellow;
font-weight:500;
background:var(--color); box-shadow:0 0 0 .35em var(--color),0 0 0 .35em;
}
.skip {
opacity:.4;
}
</style>

# Canvas | Intro & Basic Drawing
## Learning Goals
After this lesson you will be able to:
- Understand the `<canvas>` tag
- Set up a canvas 2D context
- Learn how to draw rectangles, triangles, lines, arcs and curves
## Introduction
:::info lecture
Nouvelle balise HTML : `<canvas>`
Balise pour dessiner !
:::
In this lesson we will introduce the HTML element `<canvas>` . This element is used to draw graphics via JavaScript. The `<canvas>` element is only a container for graphics. You must use JavaScript to actually draw the graphics.
## The `<canvas>` tag
:::info lecture
Un peu comme une image, mais sans `src`...
:::
:::info lecture
Nécessité de définir les attributs `width` et `height` qui vont en quelque sorte définir la résolution du dessin.
NB : pas pareil qu'une retaille CSS
:::
At first sight a `<canvas>` looks like the `<img>` element, with the only clear difference being that it doesn't have the `src` and `alt` attributes.
:::info
Indeed, the `<canvas>` element has only two attributes, `width` and `height`. These are both optional and can also be set using DOM properties. When no `width` and `height` attributes are specified, the canvas will initially be
`300px` wide and `150px` high.
:::
:::warning
The element can be sized arbitrarily by CSS, but during rendering the image is scaled to fit its layout size: if the CSS sizing doesn't respect the ratio of the initial canvas, it will appear distorted.
Conclusion: **Don't set `canvas` tag width and height through the CSS.**
:::
Let's create a new folder and some initial files in it and start playing with *canvas*:
:::info lecture
Setup :
:::
```shell
$ mkdir canvas-basics
$ cd canvas-basics
$ mkdir styles javascripts
$ touch intro.html styles/style.css javascripts/intro.js
$ code .
```
Now let's add some initial HTML code to our `index.html`:
```htmlmixed
<!DOCTYPE html>
<html>
<head>
<meta charset="utf-8">
<title>Canvas Basics</title>
<link rel="stylesheet" href="styles/style.css">
</head>
<body>
<!-- the magic happens inside this tag -
it's HTML5 tag that supports animation -->
<canvas id="example" width="300" height="300"></canvas>
<!-- include js file after DOM is loaded;
if included earlier, you have to use window.onload = function(){ ... }
approach in your intro.js file -->
<script src="javascripts/intro.js"></script>
</body>
</html>
```
It is always a good idea to supply an `id` because this makes it much easier to identify it in a script.
:::info lecture
Afin de repérer plus facilement notre élément `<canvas>` dans la page, ajoutons-lui une bordure :
:::
Also, let's add some border to our canvas. To do that we can go into *style.css* file and some code there:
```css
/* styles/style.css */
canvas {
border: 1px solid red;
}
```
:::info lecture
NB : on remarque que le `<canvas>` est blanc par défaut.
:::
## 2D Context
The `<canvas>` element creates a fixed-size drawing surface that exposes one or more rendering contexts, which are used to create and manipulate the content shown.
<div class="skip">
In this course we will focus on the **2D rendering context**, but there are other context options for `canvas` tags, actually there are 4 possible values:
- **2D**. Leading to the creation of a CanvasRenderingContext2D object representing a two-dimensional rendering context.
- **webgl**. (or "experimental-webgl") which will create a [WebGLRenderingContext](https://developer.mozilla.org/en-US/docs/Web/API/WebGLRenderingContext) object representing a three-dimensional rendering context. This context is only available on browsers that implement WebGL version 1 (OpenGL ES 2.0).
- **webgl2** which will create a [WebGL2RenderingContext](https://developer.mozilla.org/en-US/docs/Web/API/WebGL2RenderingContext) object representing a three-dimensional rendering context. This context is only available on browsers that implement WebGL version 2 (OpenGL ES 3.0).
- **bitmaprenderer** which will create an [ImageBitmapRenderingContext](https://developer.mozilla.org/en-US/docs/Web/API/ImageBitmapRenderingContext) which only provides functionality to replace the content of the canvas with a given ImageBitmap.
</div>
The `canvas` is initially blank. To display something, a script first needs to access the rendering context and draw on it. The `<canvas>` element has a method called `getContext()`, used to obtain the rendering context and its drawing functions. `getContext()` takes one parameter, the type of context. For 2D graphics, such as those we will cover on this course, we specify "2d" to get a CanvasRenderingContext2D.
:::info lecture
Dans notre fichier `javascripts/intro.js` :
:::
Now let's go into our *intro.js* file and see how we can manipulate `canvas` tag:
```javascript=
// javascripts/intro.js
var canvas = document.getElementById('example');
var ctx = canvas.getContext('2d');
```
The first line in the script retrieves the node in the DOM representing the `<canvas>` element by calling the `document.getElementById()` method. Once you have the element node, you can access the drawing context using its `getContext()` method.
:::info lecture
- L2 : nous saisissons notre élément HTML `<canvas>` de la page et enregistrons sa référence dans une variable `canvas`
- L3 : nous accédons au "contexte" du canvas
:::
:::info lecture
Si nous imprimons dans la console notre variable ctx, nous allons voir que le contexte est en réalité un gros objet :

:::
## Drawing shapes
### The Grid
:::info lecture
- Origine du repère en haut à gauche
- axe y du haut vers le bas
- une unité représente un pixel
:::
Before we can start drawing, we need to talk about the **canvas grid** or **coordinate space**. Following our `example` canvas, it has `300px` width and `300px` hight. Normally one unit in the grid corresponds to one pixel on the canvas. **The origin of this grid is positioned in the top left corner at coordinate (0,0). All elements are placed relative to this origin**.

### Rectangles
`<canvas>` elements only support two primitive shapes: **rectangles** and **paths**. All other shapes must be created by combining one or more paths, lists of points connected by lines.
🎉 Luckily, we have an assortment of path drawing functions which make it possible to compose very complex shapes.
First let's look at the rectangle. There are three functions that draw rectangles on the canvas:
:::info lecture
Pour dessiner des rectangles :
:::
```javascript
fillRect(x, y, width, height) //Draws a filled rectangle.
strokeRect(x, y, width, height) //Draws a rectangular outline.
clearRect(x, y, width, height) //Clears the specified rectangular area, making it fully transparent.
```
:::info
Each of these three functions takes the same parameters. `x` and `y` specify the position on the `canvas` (relative to the origin) of the top-left corner of the rectangle. `width` and `height` provide the rectangle's size.
:::
:::info lecture
Dessinons un rectangle plein dans notre `javascripts/intro.js`
:::
Let's go to our *intro.js* and make some *strokes* 🎯
```javascript
// javascripts/intro.js
// ...
// ****************************
// draw rectangle:
// ****************************
ctx.fillStyle="purple";
ctx.fillRect(260, 260, 30, 30);
```
Now if we open `intro.html`, we can see something like this:

We just draw our first rectangle in canvas 😁
:::info lecture
Regardons dans ce codepen les autres méthodes :
- `clearRect`
- `strokeRect`
:::
Let´s see another example of how to draw a rectangle using canvas. Go ahead and play around with it! :wink:
<iframe height='265' scrolling='no' title='brmwwb' src='//codepen.io/ironhack/embed/brmwwb/?height=265&theme-id=0&default-tab=js,result&embed-version=2' frameborder='no' allowtransparency='true' allowfullscreen='true' style='width: 100%;'>See the Pen <a href='https://codepen.io/ironhack/pen/brmwwb/'>brmwwb</a> by Ironhack (<a href='https://codepen.io/ironhack'>@ironhack</a>) on <a href='https://codepen.io'>CodePen</a>.
</iframe>
Notice that the `fillRect()` function draws a large black square `100px` on each side. The [`clearRect()`](https://developer.mozilla.org/en-US/docs/Web/API/CanvasRenderingContext2D/clearRect) function then erases a 60x60 pixel square from the center, and then `strokeRect()` is called to create a rectangular outline 50x50 pixels within the cleared square.
:::info
We also add a **`border: 1px solid red`** to the `canvas` element so you can notice the space it occupies in our document.
:::
<!-- In addition to the three methods we saw for drawing rectangles, which draw rectangular shapes directly to the canvas, there's also the `rect()` method, which adds a rectangular path to a currently open path. -->
<!-- ```javascript=
rect(x, y, width, height)
``` -->
<!-- Draws a rectangle whose top-left corner is specified by (x, y) with the specified width and height. -->
<!-- When this method is executed, the current pen position is automatically reset to the default coordinates. -->
### Paths
:::info lecture
Les chemins vont nous permettre de tracer toutes sortes de droites/segments/polygones/courbes...
:::
:::info lecture
Ces chemins pourront être fermés (remplis éventuellement d'une couleur) ou ouverts
:::
The other primitive shapes are paths. **A path is a list of points, connected by segments of lines that can be of different shapes, curved or not, of different width and of different color**.
:::info lecture
Afin de créer un chemin, nous devrons au préalable le créer gràce à `beginPath` et le terminer gràce à `closePath`
:::
A path, or even a subpath, can be closed. To make shapes using paths takes some extra steps:
1. You create the path.
2. Use drawing commands to draw into the path.
3. Close the path.
4. Once the path has been created, you can stroke or fill the path to render it.
:::info lecture
`stroke` nous permettra de faire son tracé et `fill` de le remplir d'une couleur.

:::
Here are the functions used to perform these steps:
```javascript
beginPath() // Creates a new path. Once created, future drawing commands are directed into the path and used to build the path up.
closePath() // Closes the path so that future drawing commands are once again directed to the context.
stroke() // Draws the shape by stroking its outline.
fill() // Draws a solid shape by filling the path's content area.
```
### Moving the pen
:::info lecture
Entre le début et la fin de notre tracé, nous allons vouloir dessiner, comme avec un crayon.
<span style="font-size:500%;">🖊️</span>
:::
One very useful function, which doesn't actually draw anything but becomes part of the path list described above, is the `moveTo()` function. You can probably best think of this as lifting a pen or pencil from one spot on a piece of paper and placing it on the next.
```javascript=
moveTo(x, y) // Moves the pen to the coordinates specified by x and y.
```
:::info lecture
`moveTo` relève la mine du papier et déplace le stylo en `x,y` : **on ne trace donc rien**
:::
When the canvas is initialized or `beginPath()` is called, you typically will want to use the `moveTo()` function to place the starting point somewhere else. We could also use `moveTo()` to draw unconnected paths.
### Lines
For drawing straight lines, use the lineTo() method.
```javascript=
lineTo(x, y) // Draws a line from the current drawing position to the position specified by x and y.
```
:::info lecture
`lineTo` va quant à elle **tracer une droite**, depuis où le crayon se trouve (déplacé grâce à `moveTo`), jusqu'au point que indiqué.
:::
This method takes two arguments, x and y, which are the coordinates of the line's end point. The starting point is dependent on previously drawn paths, where the end point of the previous path is the starting point for the following, etc. The starting point can also be changed by using the `moveTo()` method.
Let's add some code to our `intro.js` file:
:::info lecture
Traçons un chemin :
:::
```javascript=
// javascripts/intro.js
// ...
// ****************************
// draw path
// ****************************
// start the path
ctx.beginPath();
// starting position is x=50, y=50
ctx.moveTo(50, 50);
// draw the line that has final coordinates x=250, y=50
ctx.lineTo(250, 50);
// .stroke() executes the drawing
ctx.stroke();
// start a new line from these coordinates: x=250, y=50
ctx.moveTo(250, 50);
// draw the line that has final coordinates x=250, y=100
ctx.lineTo(250, 100);
// .stroke() executes the drawing
ctx.stroke();
// close the path
ctx.closePath();
```
:::info lecture
- NB1 : on aurait très bien pu appelé `stroke()` après `closePath()`
- NB2 : on aurait pu tracer une ligne discontinues L19 en `moveTo(250,60)` par ex
:::
If we refresh our `intro.html` we should see this:

To summarize previous:
- The first step to create a path is to call the `beginPath()`. Internally, paths are stored as a list of sub-paths (lines, arcs, etc) which together form a shape. Every time this method is called, the list is reset and we can start drawing new shapes.
- The second step is calling the methods that actually specify the paths to be drawn.
- The third, and an optional step, is to call `closePath()`. This method tries to close the shape by drawing a straight line from the current point to the start. If the shape has already been closed or there's only one point in the list, this function does nothing.
Here is another example:
:::info lecture
Un autre ex intéressant avec `fill()` :
:::
<iframe height='265' scrolling='no' title='Drawing a triangle' src='//codepen.io/ironhack/embed/jLeVNm/?height=265&theme-id=0&default-tab=result&embed-version=2' frameborder='no' allowtransparency='true' allowfullscreen='true' style='width: 100%;'>See the Pen <a href='https://codepen.io/ironhack/pen/jLeVNm/'>Drawing a triangle</a> by Ironhack (<a href='https://codepen.io/ironhack'>@ironhack</a>) on <a href='https://codepen.io'>CodePen</a>.
</iframe>
:::info
When you call `fill()`, any open shapes are closed automatically, so you don't have to call `closePath()`. This is not the case when you call `stroke()`.
:::
:::info lecture
`closePath()` est implicitement appelé avec de `fill()`
:::
### Arcs
Not everything will be lines and paths, we will need some curves right? So to draw arcs or circles, we use the `arc()` or `arcTo()` methods.
:::info lecture
Pour faire des cercles ou des arcs, 2 façons :
:::
```javascript
arc(x, y, radius, startAngle, endAngle, anticlockwise)
// Draws an arc which is centered at (x, y) position with
// radius starting at startAngle and ending at endAngle going
// in the given direction indicated by anticlockwise (defaulting to clockwise).
```
:::info lecture

:::
```javascript
arcTo(x1, y1, x2, y2, radius)
// Draws an arc with the given control points and radius,
// connected to the previous point by a straight line.
```
:::info lecture

- start point en bleu
- P1 en bas
- P2 en haut
:::
Let's have a more detailed look at the `arc` method, which takes six parameters: ç
- `x` and `y` are the coordinates of the center of the circle on which the arc should be drawn.
- `radius` is self-explanatory.
- `startAngle` and `endAngle` parameters define the start and end points of the arc in radians, along with the curve of the circle. These are measured from the x-axis.
- `anticlockwise` parameter is a `Boolean` value which, when true, draws the arc anticlockwise; otherwise, the arc is drawn clockwise.
:::info
Angles in the arc function are measured in radians, not degrees. To convert degrees to radians you can use the following JavaScript expression:
```javascript
radians = (Math.PI/180)*degrees.
```
:::
:::info lecture
TOUJOURS en radians !
:::
---
Let's see a very simple example:
```javascript
// javascripts/intro.js
// ...
// ****************************
// draw circle
// ****************************
ctx.beginPath();
// ctx.arc(x, y, radius, startAngle, endAngle)
ctx.arc(150, 170, 75, 0, Math.PI * 2);
ctx.lineWidth = 20;
ctx.strokeStyle = "green"; // !
ctx.stroke();
ctx.closePath();
ctx.beginPath();
ctx.arc(150, 170, 35, 0, Math.PI * 2);
ctx.fillStyle = "red"; // !
// fills the inner circle with red color
ctx.fill();
ctx.closePath();
```
After refreshing `intro.html`, we can see the following:

Not bad ha? 🥳
Although we will touch a bit more the topics of styling in the next learning unit, here we saw the two very important methods:
- **fillStyle = color**; <== Sets the style used when filling shapes
- **strokeStyle = color**; <== Sets the style for shapes’ outlines
Here is another example:
<iframe height='265' scrolling='no' title='BdqQJR' src='//codepen.io/ironhack/embed/BdqQJR/?height=265&theme-id=0&default-tab=js,result&embed-version=2' frameborder='no' allowtransparency='true' allowfullscreen='true' style='width: 100%;'>See the Pen <a href='https://codepen.io/ironhack/pen/BdqQJR/'>BdqQJR</a> by Ironhack (<a href='https://codepen.io/ironhack'>@ironhack</a>) on <a href='https://codepen.io'>CodePen</a>.
</iframe>
## Making some combinations
So far, each example in this lesson has used only one type of path function per shape. However, there's no limitation to the number or types of paths you can use to create a shape. So in this final example, let's combine all of the path functions to make a set of very famous game characters.
<iframe height='265' scrolling='no' title='Making combinations' src='//codepen.io/ironhack/embed/GvYNem/?height=265&theme-id=0&default-tab=result&embed-version=2' frameborder='no' allowtransparency='true' allowfullscreen='true' style='width: 100%;'>See the Pen <a href='https://codepen.io/ironhack/pen/GvYNem/'>Making combinations</a> by Ironhack (<a href='https://codepen.io/ironhack'>@ironhack</a>) on <a href='https://codepen.io'>CodePen</a>.
</iframe>
### Exercises
#### RSS Example
Cool huh? Now is your turn. Let´s start with some basic shapes! First, we will try the RSS symbol, something like this:

You can use this CodePen for practicing. And forget about colors, for now, we only need the shapes!
<iframe height='265' scrolling='no' title='Practice Canvas' src='//codepen.io/ironhack/embed/mMzONm/?height=265&theme-id=0&default-tab=html,result&embed-version=2' frameborder='no' allowtransparency='true' allowfullscreen='true' style='width: 100%;'>See the Pen <a href='https://codepen.io/ironhack/pen/mMzONm/'>Practice Canvas</a> by Ironhack (<a href='https://codepen.io/ironhack'>@ironhack</a>) on <a href='https://codepen.io'>CodePen</a>.
</iframe>
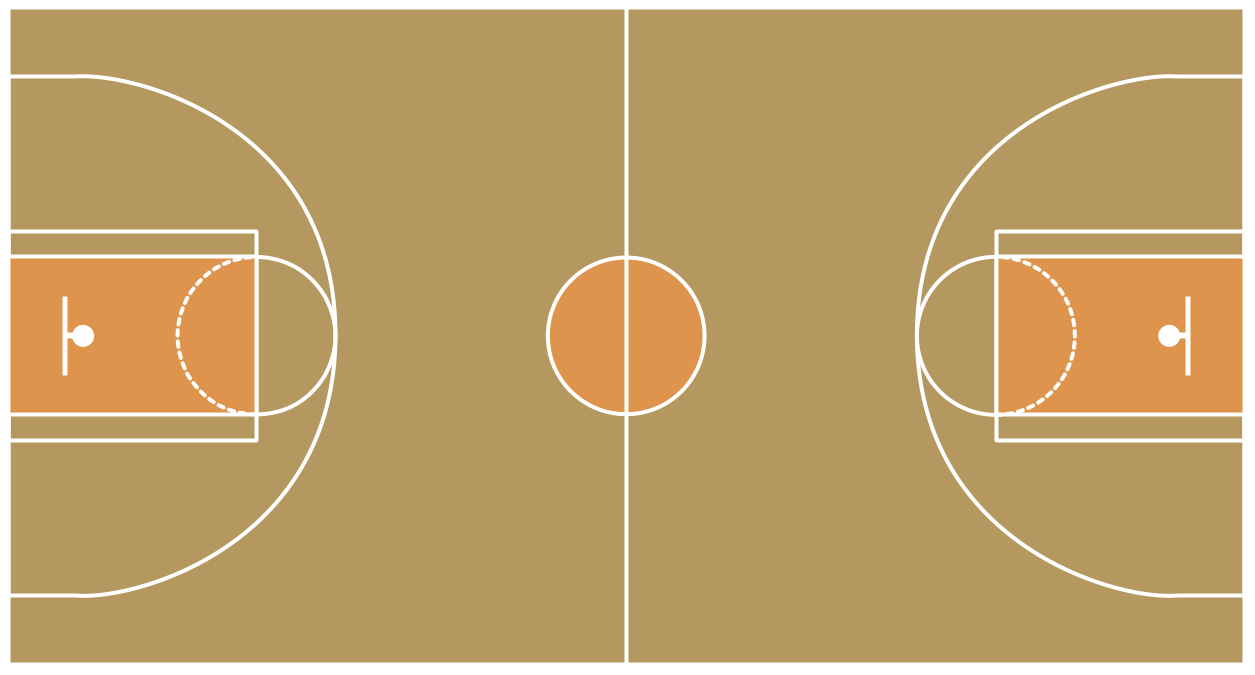
#### Basketball Court
Let move to a more advanced image, let´s try a basketball court. Focus on every shape, it seems complicated but moves step by step. :muscle:
## Summary
We introduce in the `canvas` world. We learn how to add a `canvas` element on our HTML, set the context and start drawing some things. We also see how combining this basics draws, we can create awesome stuff.
On the following lessons, we will see some awesome things we can make using `canvas`. Let´s do it!
## Extra Resources
- [Canvas Tutorials](http://www.html5canvastutorials.com/)