
By LSChyi
----
## Not in this

----
## <del>Not Eren Yeager</del>

---
# Jaeger
Monitor and troubleshoot transactions in complex distributed systems
----
## Why Jaeger
### or another trace service
----
## Purpose
* To easily understand what happens for a execution path for microservice architectures
* or even for distributed systems
* Store logs in a independent services, even the service crashes
* Easy to setup
* Nice query interface to aid analyze
----
* logs are not organized
* you need to dig, grep from a messy logs
* even worse - logs are on different instances

----
## What can we do with Jaeger
* Monitor distributed transactions
* Optimize performance and latency
* Perform root cause analysis
----
## Nice feature in Jaeger
* Integration with Kiali
* High scalability
* Distributed Context Propagation
* Backwards compatibility with Zipkin
*From [openshift](https://docs.openshift.com/container-platform/4.1/service_mesh/service_mesh_arch/ossm-jaeger.html#:~:text=Jaeger%20is%20made%20up%20of,implementations%20of%20the%20OpenTracing%20API.)*
---
# Architecture And Concepts
----
----
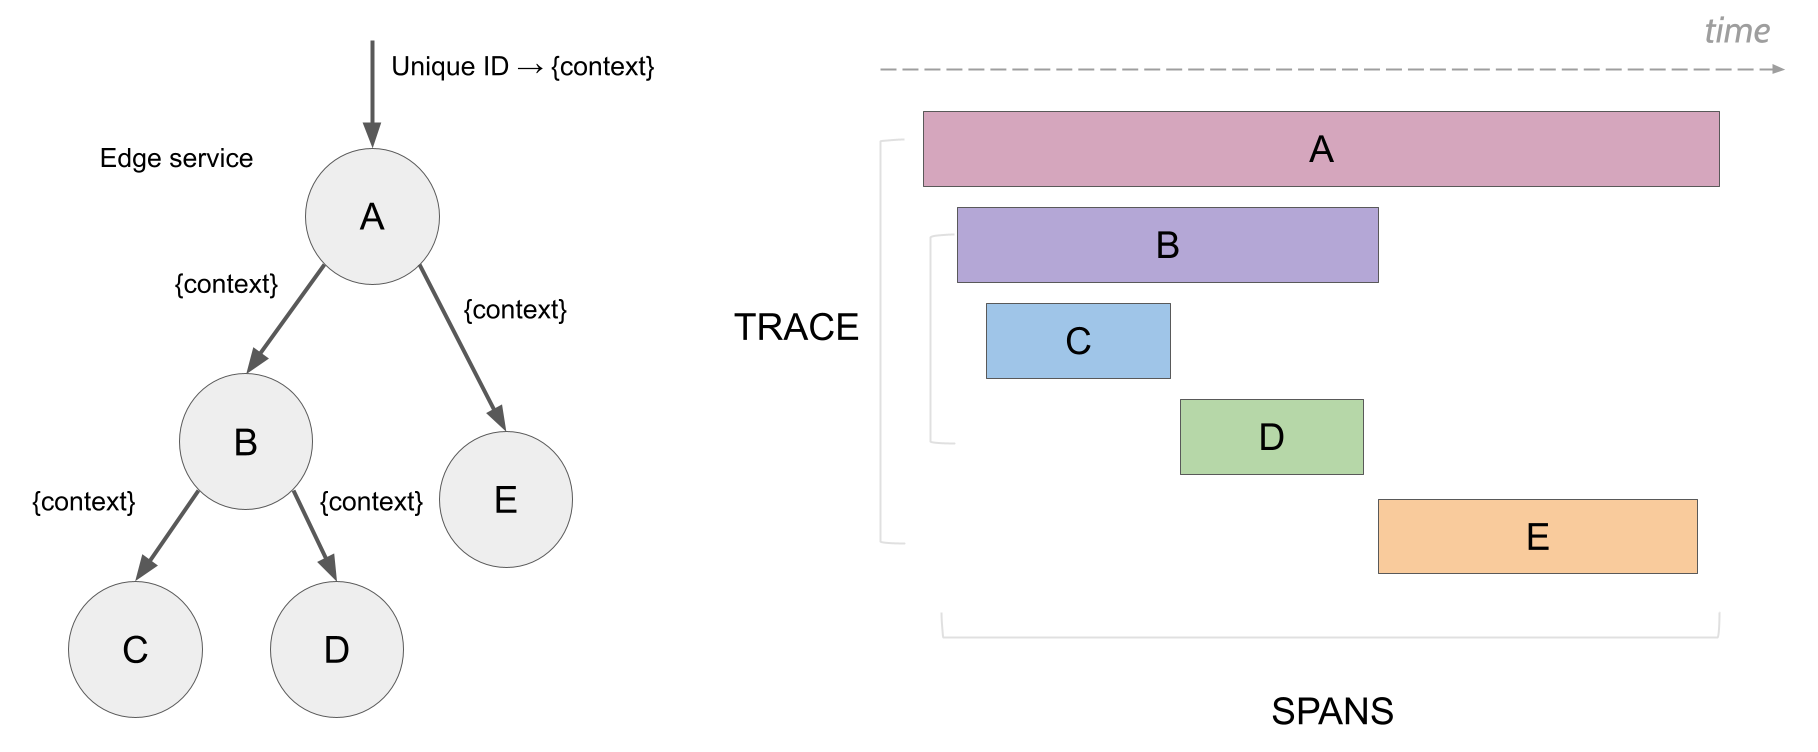
## Concepts: Span and Trace
----
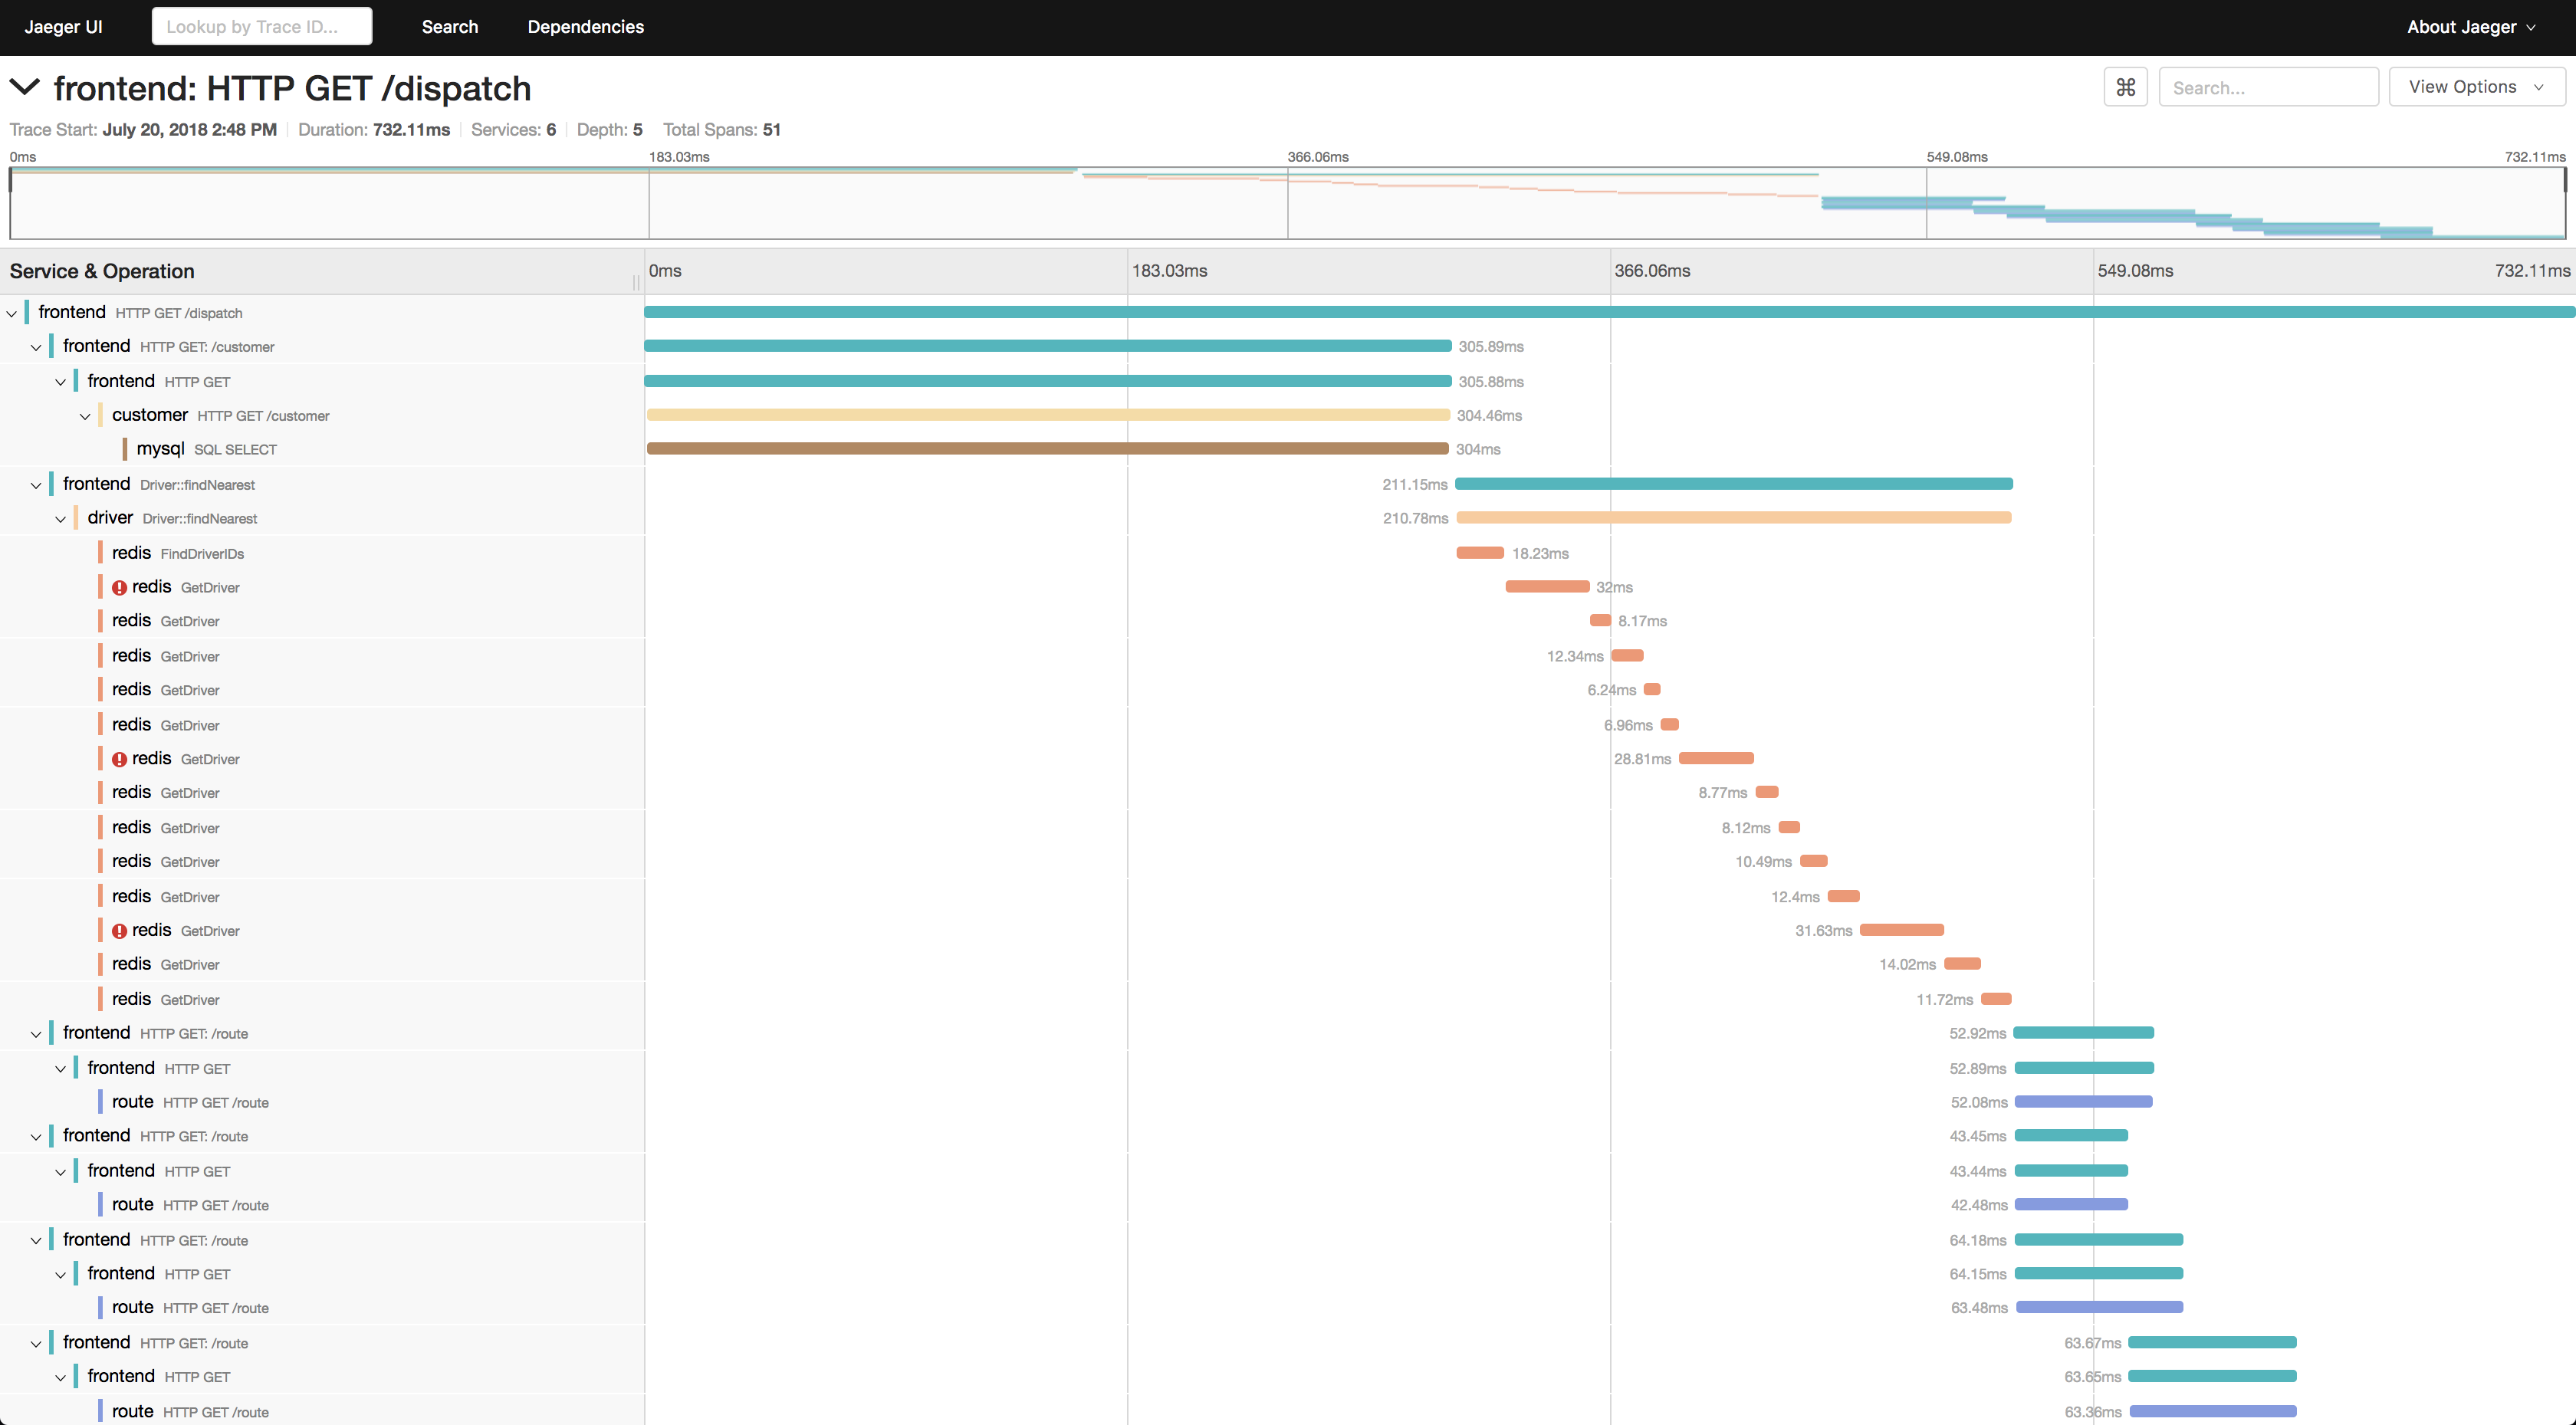
## Screenshots (Cont.)
----
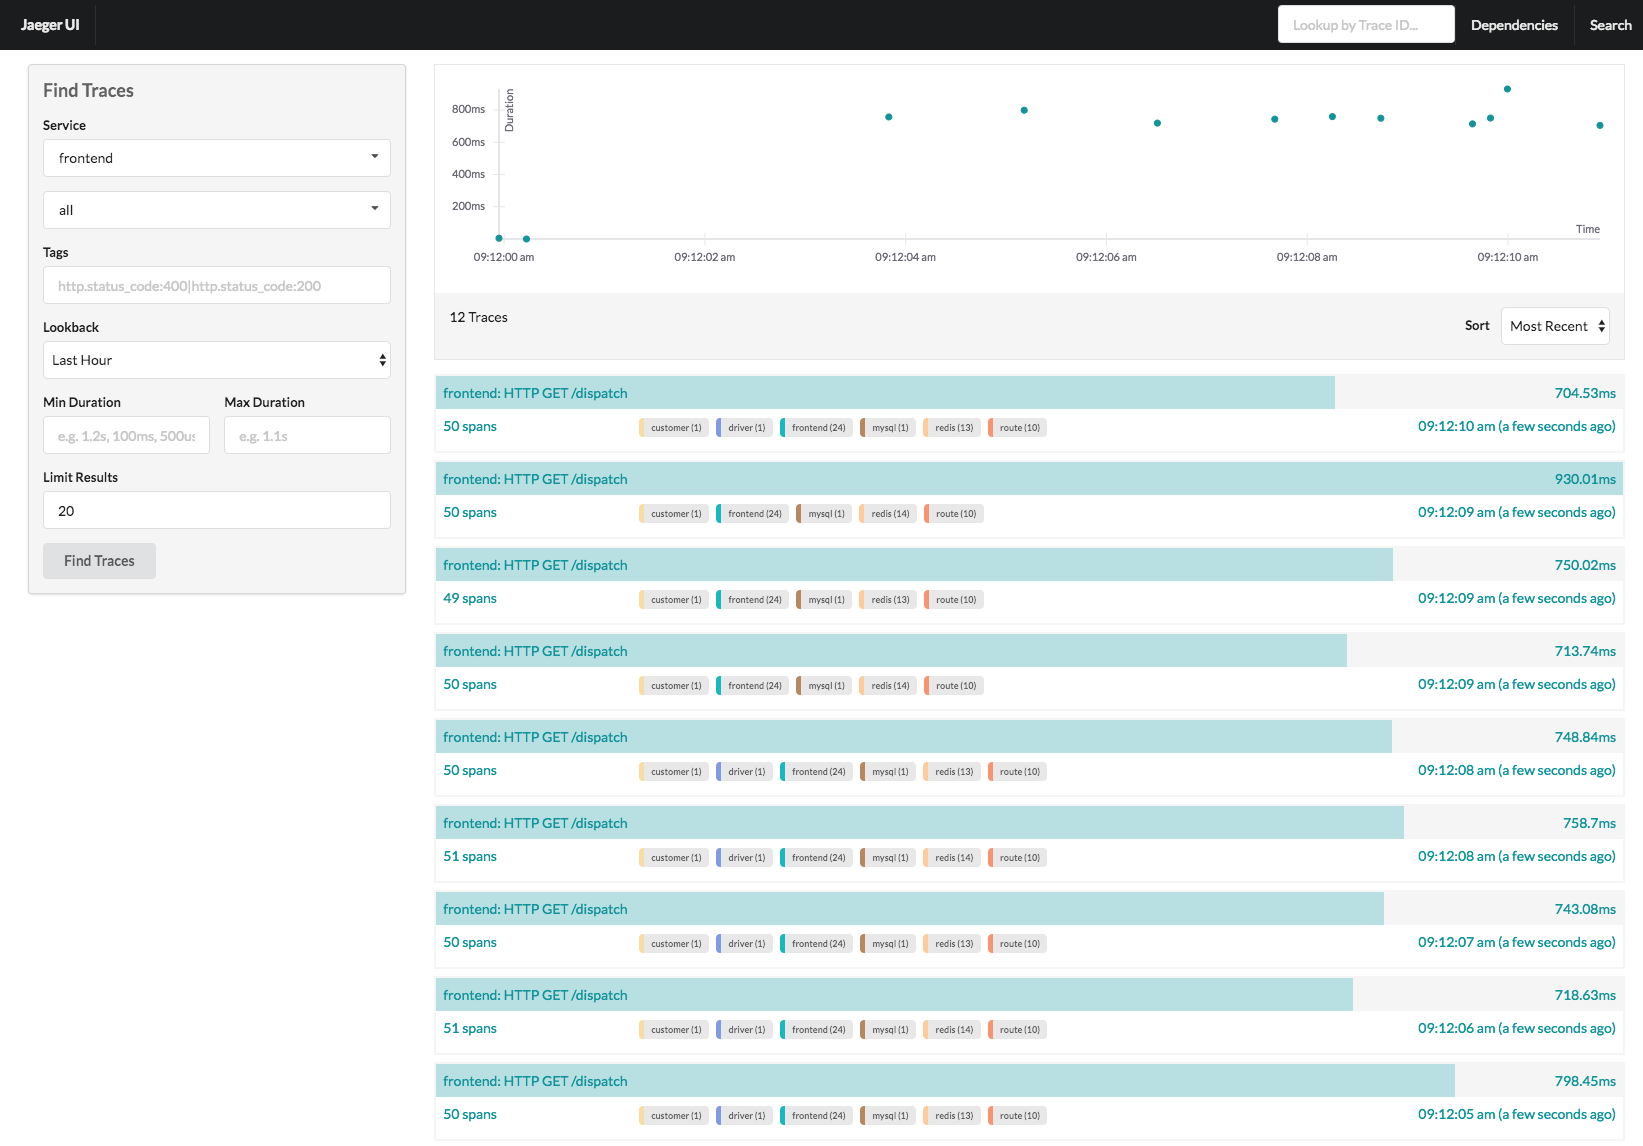
## Screenshots
----
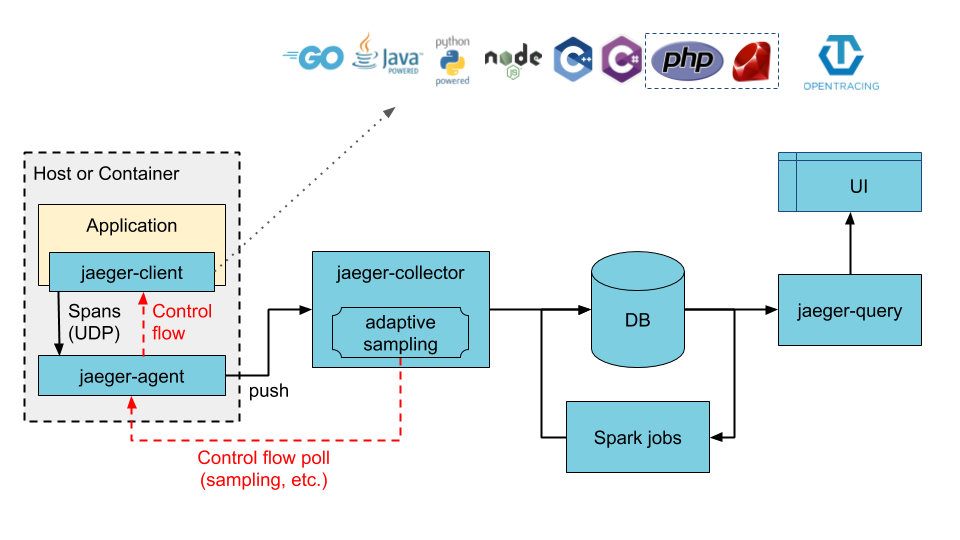
## Components

----
## Components (Cont.)
* Application + Jaeger-client
* Jaeger-agent (optional, nice to use)
* Jaeger-collector
* Storage module
* Jaeger-query and Jaeger-UI
----
## Components (Cont.)

----
## Jaeger-client
### official libraries
* **Go**
* Java
* Node.js
* Python
* C++
* C#
*[Feature compatibility matrix](https://www.jaegertracing.io/docs/1.22/client-features/)*
----
## Jaeger-agent (optional)
* Coordinator for sending data to the Jaeger-collector
* handles how many connection to use, etc
* Add some more useful data
* Usually used as a sidecar for every service or
* one instance per node or
* one instance per cluster
* Optional, client library can also directly send data to the Jaeger-collector
----
## Jaeger-collector
* Collect data and send to DB
----
## Storage module
### Supported storage backends
* Cassandra 3.4+
* Elasticsearch 5.x, 6.x, 7.x
* Kafka
* memory storage
----
## Jaeger-query and
## Jaeger-UI
* Web interface to query data from DB
---
# How to use Jaeger
----
# Quickstart
Use the all-in-one image
```
docker run -d --name jaeger \
-e COLLECTOR_ZIPKIN_HTTP_PORT=9411 \
-p 5775:5775/udp \
-p 6831:6831/udp \
-p 6832:6832/udp \
-p 5778:5778 \
-p 16686:16686 \
-p 14268:14268 \
-p 14250:14250 \
-p 9411:9411 \
jaegertracing/all-in-one:1.22
```
----
## service, operation and tags

----
### Service
```go=
cfg := &config.Configuration{
ServiceName: SERVICE,
Sampler: &config.SamplerConfig{
Type: "const",
Param: 1,
},
Reporter: &config.ReporterConfig{
LocalAgentHostPort: agentAddr,
},
}
tracer, closer, err := cfg.NewTracer(config.Logger(jaeger.StdLogger))
```
----
### Create Trace and Span (filter by operation field)
#### Also with tags and logs
```go=
rootSpan = tracer.StartSpan(SPAN)
rootSpan.SetTag(TAG_NAME, TAG_VALUE)
rootSpan.LogKV(LOG_KEY, LOG_KEY_CONTENT)
rootSpan.Finish() // only the finished span can be sent out
```
----

----
### Tags or Log?
* Tag is the attribute for the hole span
* Log is the event at a time point

----
### Trace are not organized by string value, but by the ID
* Each trace and span has an ID, traces and spans with the same name do not treated as the same
* only the trace (span) with the same ID is organized as an entry
----
### Create child span
```go=
checkSpan = tracer.StartSpan(
SPAN_NAME,
opentracing.ChildOf(rootSpan.Context()),
)
```
----

----
### Make trace across different microservice (process) in the same trace
* Jaeger supports several different ways to pass the trace context to different microservice, thus easy to understand a execution path across different microservices
* TextMap
* Binary
* HTTPHeader
----

----
#### Baggage
* Context passed to different process does not contain all the data that was previously stored in the context, using the Baggage in Jaeger-client library allows you to pass everything to the next process
* Be aware of the data size
---
# Performance Impact
----
## Tunable, and less than we thought (from application view)
* By default, Jaeger uses UDP to send trace, so client do not keep a connection resource to ensure data is sent to the Jaeger-agent
* Most of the performance impact comes from how much data you buffered before calling `Finish` to sent them out, and the sampling rate
----
## Other tuning guide
Refer to [Performance Tuning Guide](https://www.jaegertracing.io/docs/1.22/performance-tuning/) from Jaeger
{"metaMigratedAt":"2023-06-15T20:54:47.113Z","metaMigratedFrom":"YAML","title":"Jaeger","breaks":true,"slideOptions":"{\"theme\":\"solarized\"}","contributors":"[{\"id\":\"fd9971ad-bfab-44db-9c69-54cd07fe3fc9\",\"add\":5775,\"del\":103}]"}