# Build an Automated Plant Monitoring System
##### Author: Samuel Thand (st223cm)
:::info
If you have many plants at home, it can be tough keeping up with each one according to its needs.
This system gives the user the possibility to monitor the environment of a certain plant. Temperature, air humidity, brightness and soil moisture can be studied in real time, as well as over timespans, using a graphical interface.
It also allows for alerts to be sent over email, Discord or other mediums using webhooks, and provides an automated watering system.
:::


*Building this system should take ~10 hours, depending on experience and any unforeseen issues.*
## Objective
I built this system so that I could monitor all relevant factors that can affect the growth of a plant over the internet, and to automate the process of watering the plant. It's also a very interesting project to make, since you will need to dive into many different field such as **circuit theory**, **analog and digital signals**, **communication protocols**, **low level data communication**, programming of self reliant persistent **embedded systems**, **server, container** and **database technology** among others.
Without this sensor data, many decisions about how to water, position the plant, control the temperature and humidity would be left to guesswork. But with access to present and historical data, a more scientific/data driven approach is possible.
The collected sensor data can be aggregated into useful KPI:s (Key Performance Indicators), which can help the user make informed decisions and conclusions about the growing of the plant.
## Materials
To build this system, you will need the following:
|Hardware|Description|Image|Links|
|----|----|----|----|
|PC for development|You will need a computer to configure the microcontroller as well as develop, upload and test the project code.||
|LoPy 4 Microcontroller| This is the microcontroller used in the project. Mine was bought used.||<ul><li>[LoPy4 - €38.45](https://pycom.io/product/lopy4/)</li><li>[Datasheet](https://docs.pycom.io/gitbook/assets/specsheets/Pycom_002_Specsheets_LoPy4_v2.pdf)</li><li>[Pinout](https://docs.pycom.io/gitbook/assets/lopy4-pinout.pdf)</li></ul>
|Pycom Expansion Board 3.1|A board that allows easy connection to the pins using jumper cables, micro USB access for programming and more. Mine was bought used.||<ul><li>[Expansion Board - €17.60](https://pycom.io/product/expansion-board-3-0/)</li><li>[Datasheet](https://docs.pycom.io/gitbook/assets/expansion3-specsheet-1.pdf)</li><li>[Pinout](https://docs.pycom.io/gitbook/assets/expansion3-pinout.pdf)</li></ul>
|Raspberry Pi 4|This is the computer used to host the backend for the system. Bought the OKdo kit from Kjell.com|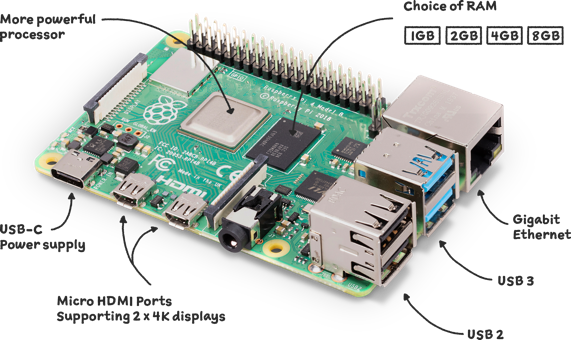|<ul><li>[Raspberry Pi 4](https://www.raspberrypi.com/products/raspberry-pi-4-model-b/)</li><li>[OKdo RPI4 Kit - 1199SEK](https://www.kjell.com/se/produkter/dator/raspberry-pi/okdo-raspberry-pi-4-2-gb-kit-p88076)</li></ul>|
|**Sensors & Components**| | | |
|DHT-11 Digital Temperature and Humidity Sensor| Digital sensor which is used to get humidity readings.||[DHT11 - 49SEK](https://www.electrokit.com/produkt/digital-temperatur-och-fuktsensor-dht11/)|
|MCP9700 Temperature sensor| Analog sensor which is used to get temperature readings.||[MCP9700 - 15SEK](https://www.electrokit.com/produkt/mcp9700a-to-92-temperaturgivare/)
|Photoresistor Light Sensor|Analog sensor which is used to get light readings.||[Photoresistor - 39SEK](https://www.electrokit.com/produkt/ljussensor/)|
|FC-28 Soil Moisture Sensor|Analog sensor which is used to get soil moisture readings.||[FC-28 - 29SEK](https://www.electrokit.com/produkt/jordfuktighetssensor/)|
|Micro USB - USB 2.0 Cable with data transfer capability|Cable needed to power the microcontroller from a computer, flash firmware and upload the code project to the device.|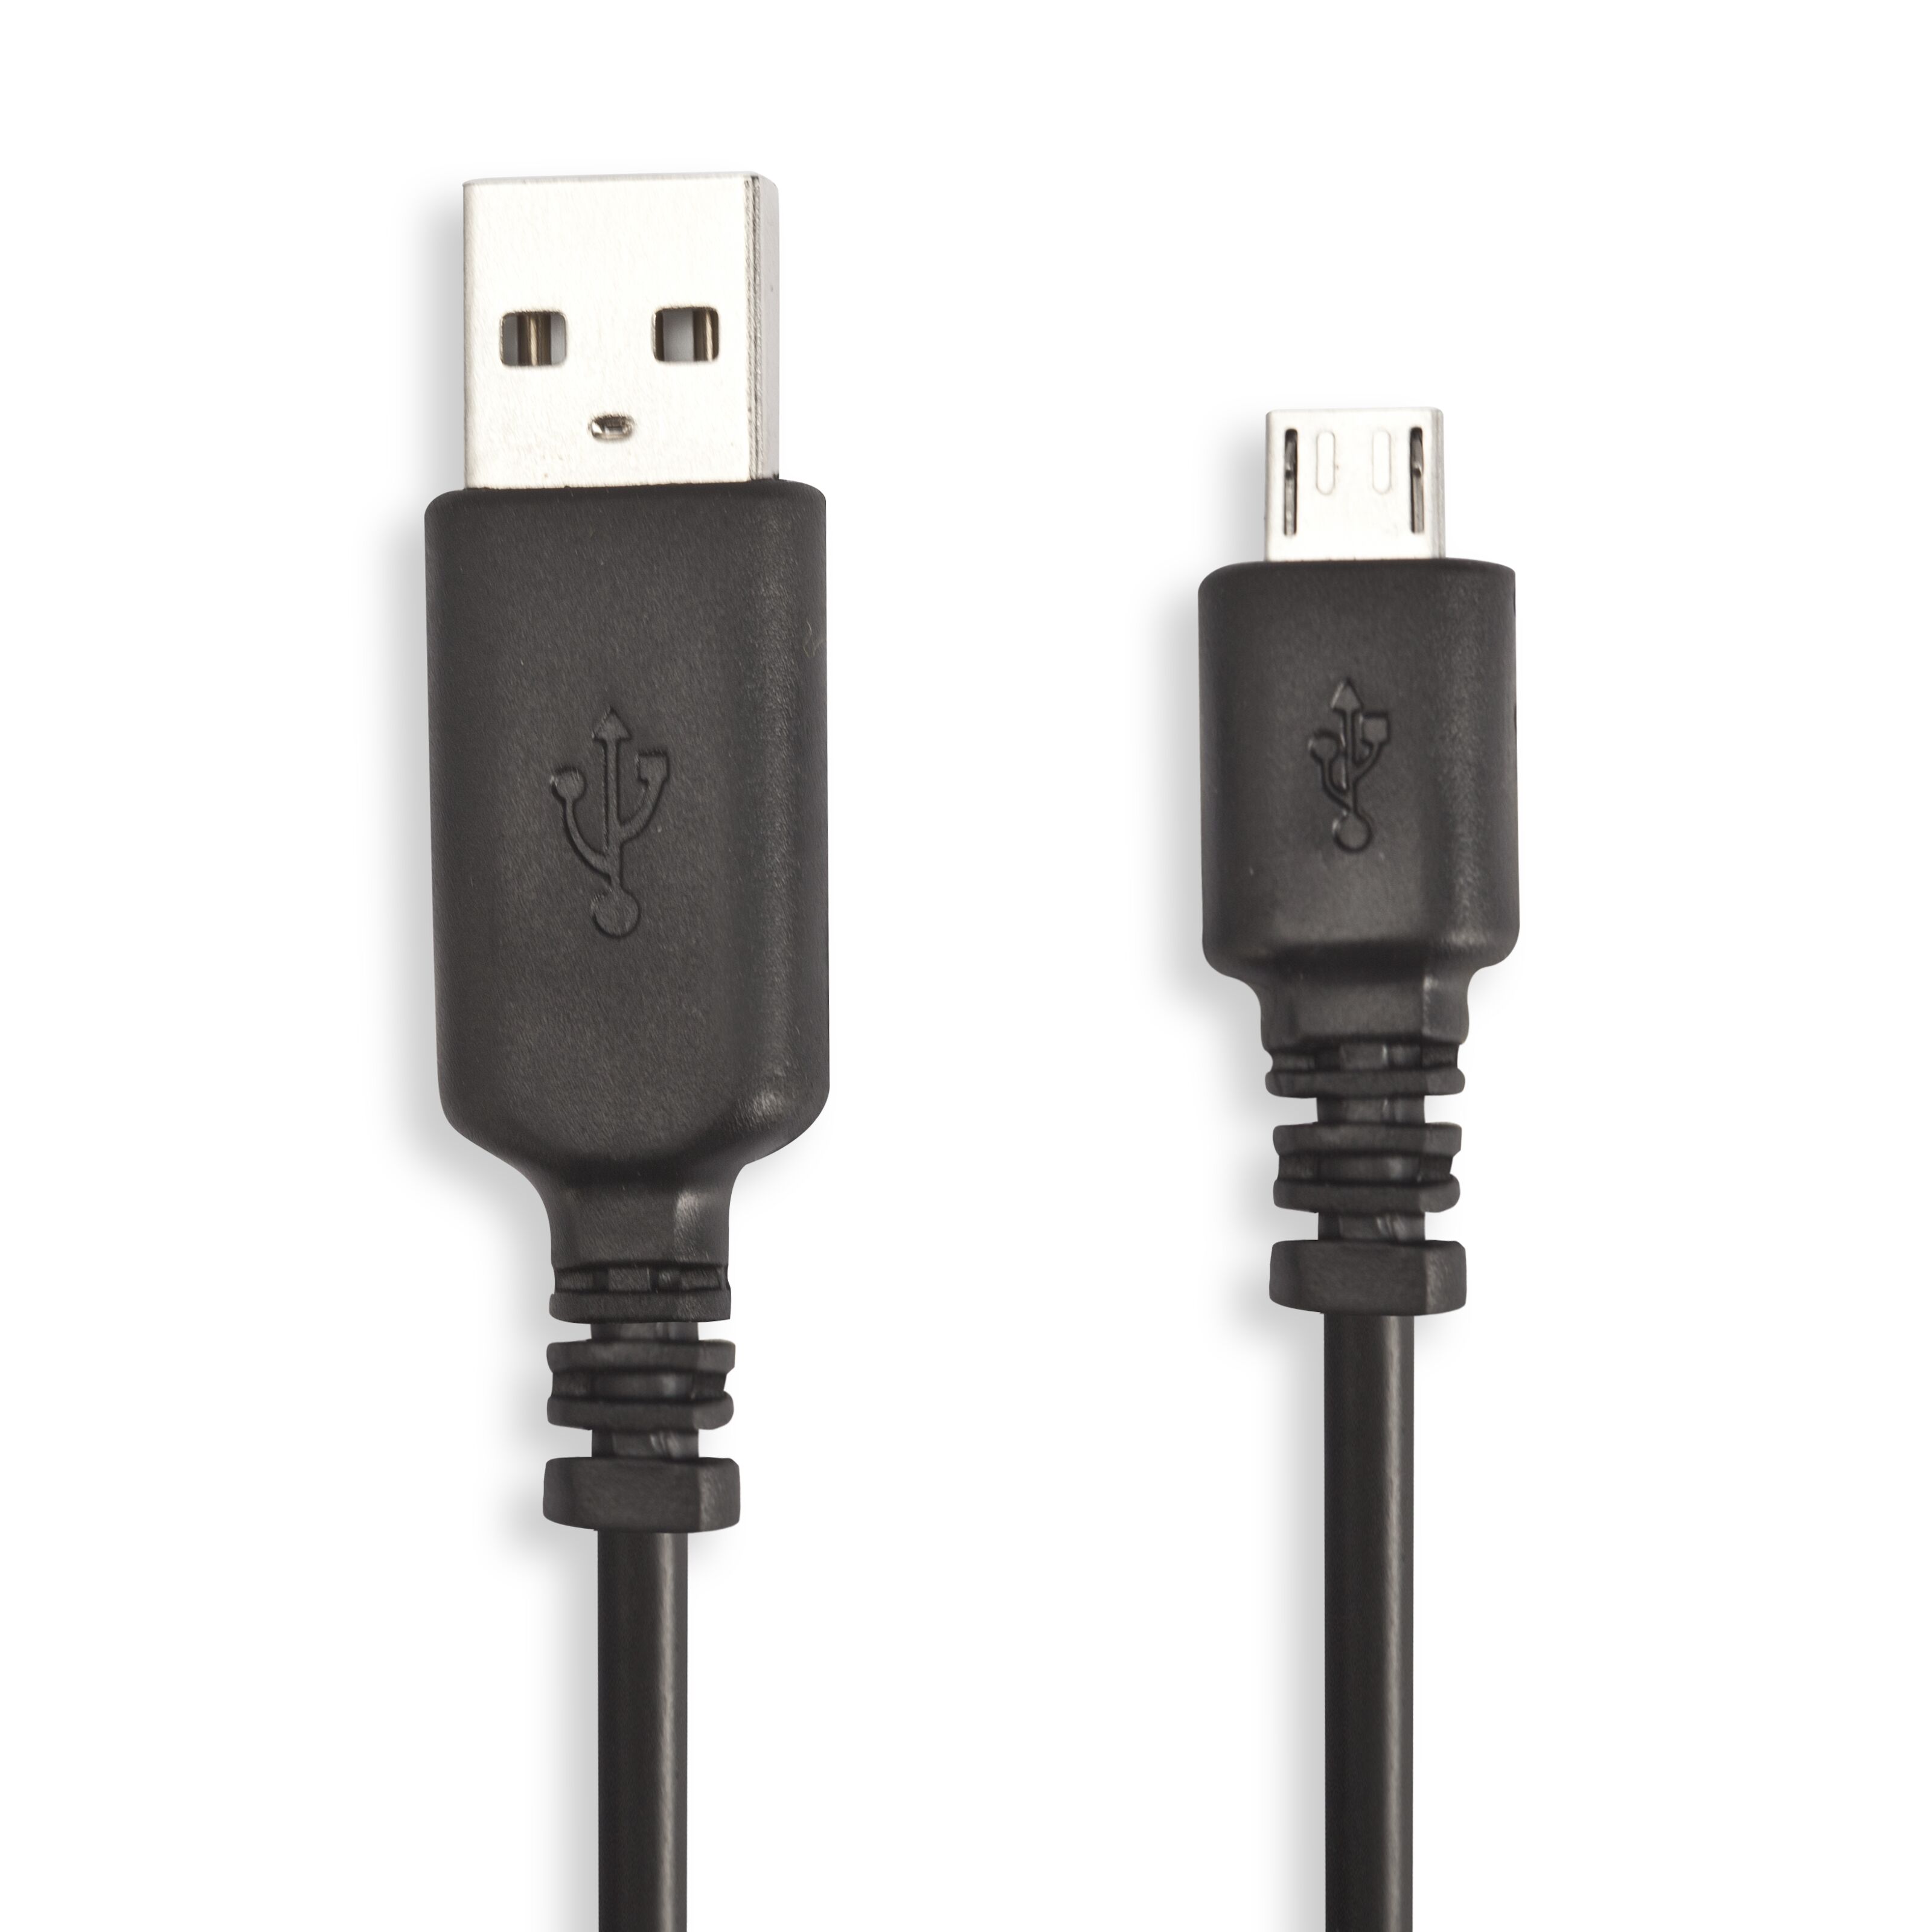|[Micro USB - USB 2.0 - 220SEK](https://www.kjell.com/se/produkter/dator/kablar-adaptrar/usb/usb-kablar/linocell-micro-usb-kabel-svart-5-m-p93828)
|USB-A AC-Converter 3 Ampere|Needed to power the microcontroller from an AC wall outlet when the system is deployed.|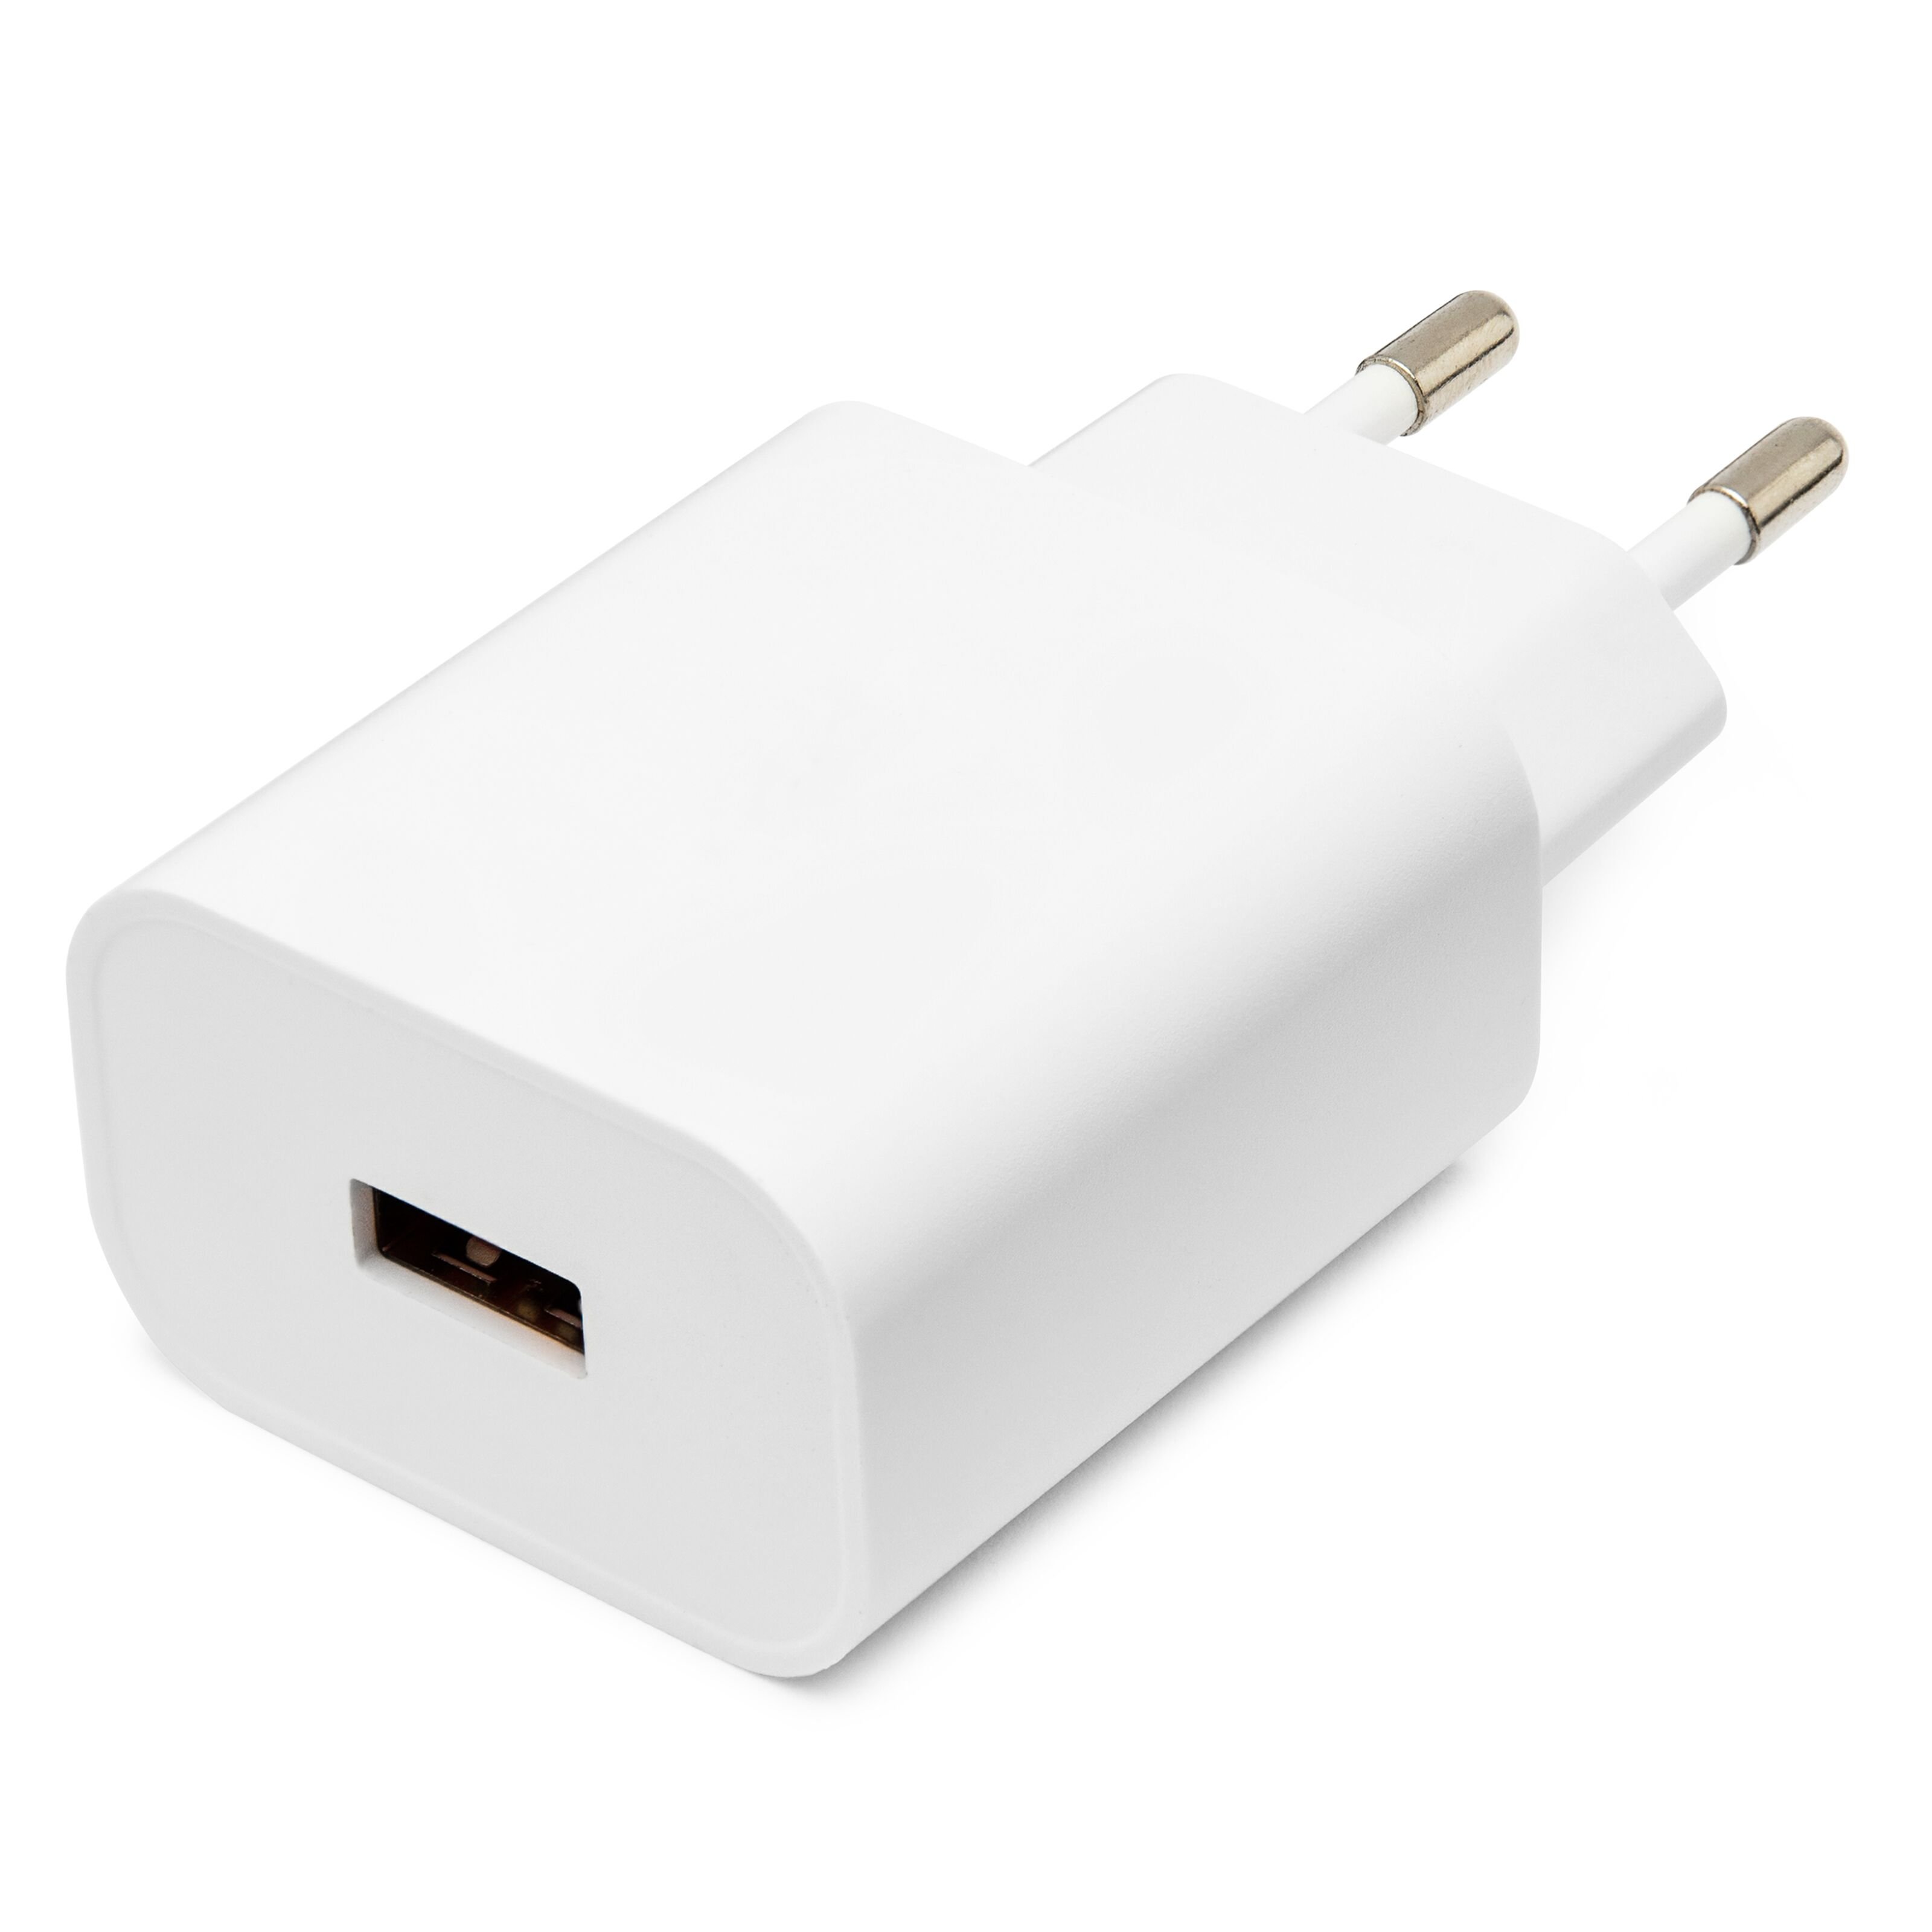|[USB-A AC-Coverter 3A - 200SEK](https://www.kjell.com/se/produkter/dator/datortillbehor/usb-tillbehor/usb-laddare/linocell-3-a-usb-laddare-quick-charge-3.0-vit-p90294)|
|Micro-SD reader|Needed to flash a Linux image to a micro-SD card for the Raspberry Pi 4|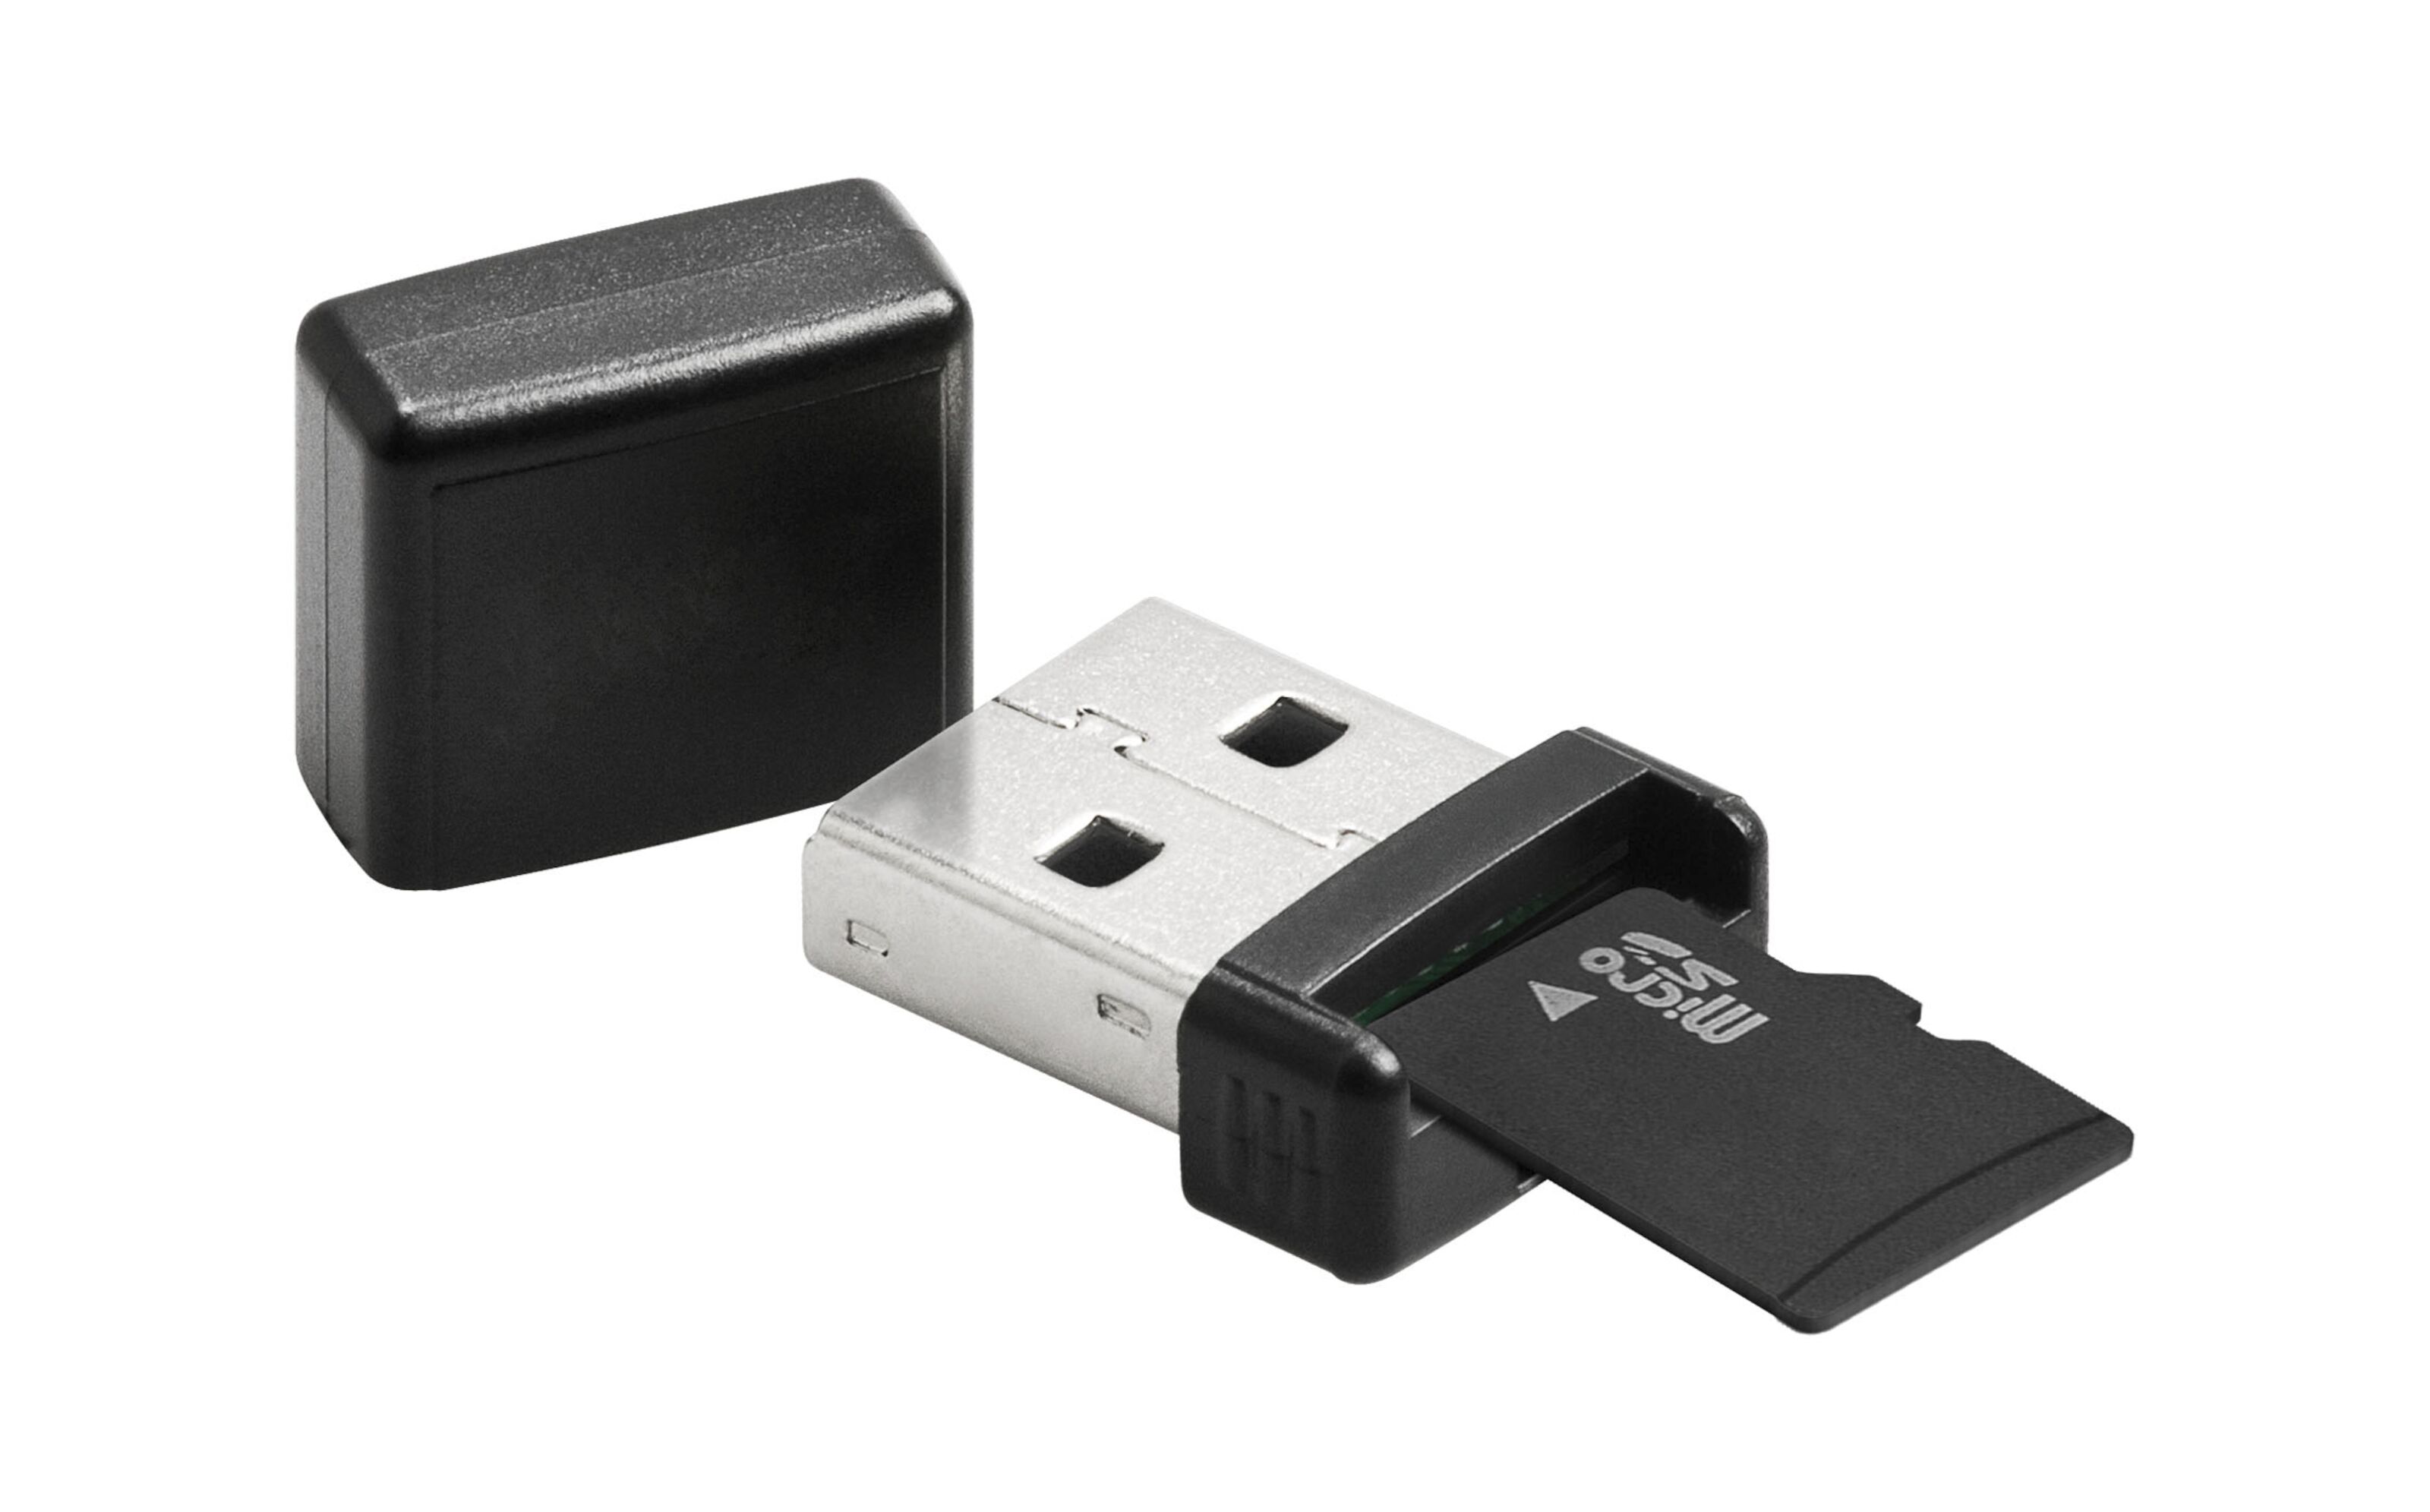|[Micro-SD reader - 150SEK](https://www.kjell.com/se/produkter/dator/datortillbehor/minneskortlasare/minneskortlasare-for-micro-sd-p68713)
|Breadboard 840 tie-points|Needed to build the system circuits without soldering or printing a PCB board.||[Breadboard - 69SEK](https://www.electrokit.com/en/product/solderless-breadboard-840-tie-points-2/)|
|Jumper Wires Male-Male|Needed to connect the components of the system.||[Jumper Wires Male-Male - 33SEK](https://www.electrokit.com/en/product/test-wires-100mm-m-m-30pcs/) |
|Jumper Wires Male-Female|Needed to connect the components of the system.||[Jumper Wires Male-Female - 29SEK](https://www.electrokit.com/en/product/jumper-wires-20-pin-30cm-female-male/)|
|Resistors 10k Ohm|Needed for the photoresistor circuit if not using the sensor with a breakout-board.||[Resistor 10k Ohm - 1SEK](https://www.electrokit.com/en/product/resistor-carbon-film-0-25w-10kohm-10k/)
|Relay Module 5VDC| Needed to control the water pump circuit.||[Relay Module 5VDC - 39SEK](https://www.electrokit.com/en/product/relay-module-5v/)|
|Submersible Water Pump 3V|Needed for pumping water from the reservoar to the plant.||[Submersible Water Pump 3V - 39SEK](https://www.electrokit.com/en/product/drankbar-pump-3v/)|
|Battery Holder 2xAA|Needed to power the pump circuit.||[Battery Holder 2xAA - 19SEK](https://www.electrokit.com/en/product/battery-holder-2xaa-box-w-switch-and-cables/)|
|6MM PVC Water Hose|Needed for the water pump|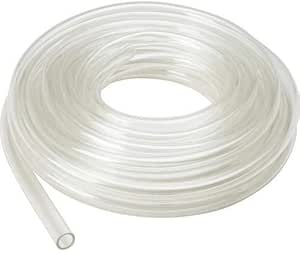|
|Water Reservoir|Needed for the pump system||
|**Tools**||||
|Electrical tape|Needed to splashproof the soil moisture sensor, tape soldered connections for durability and fixate the water hose to the plant.|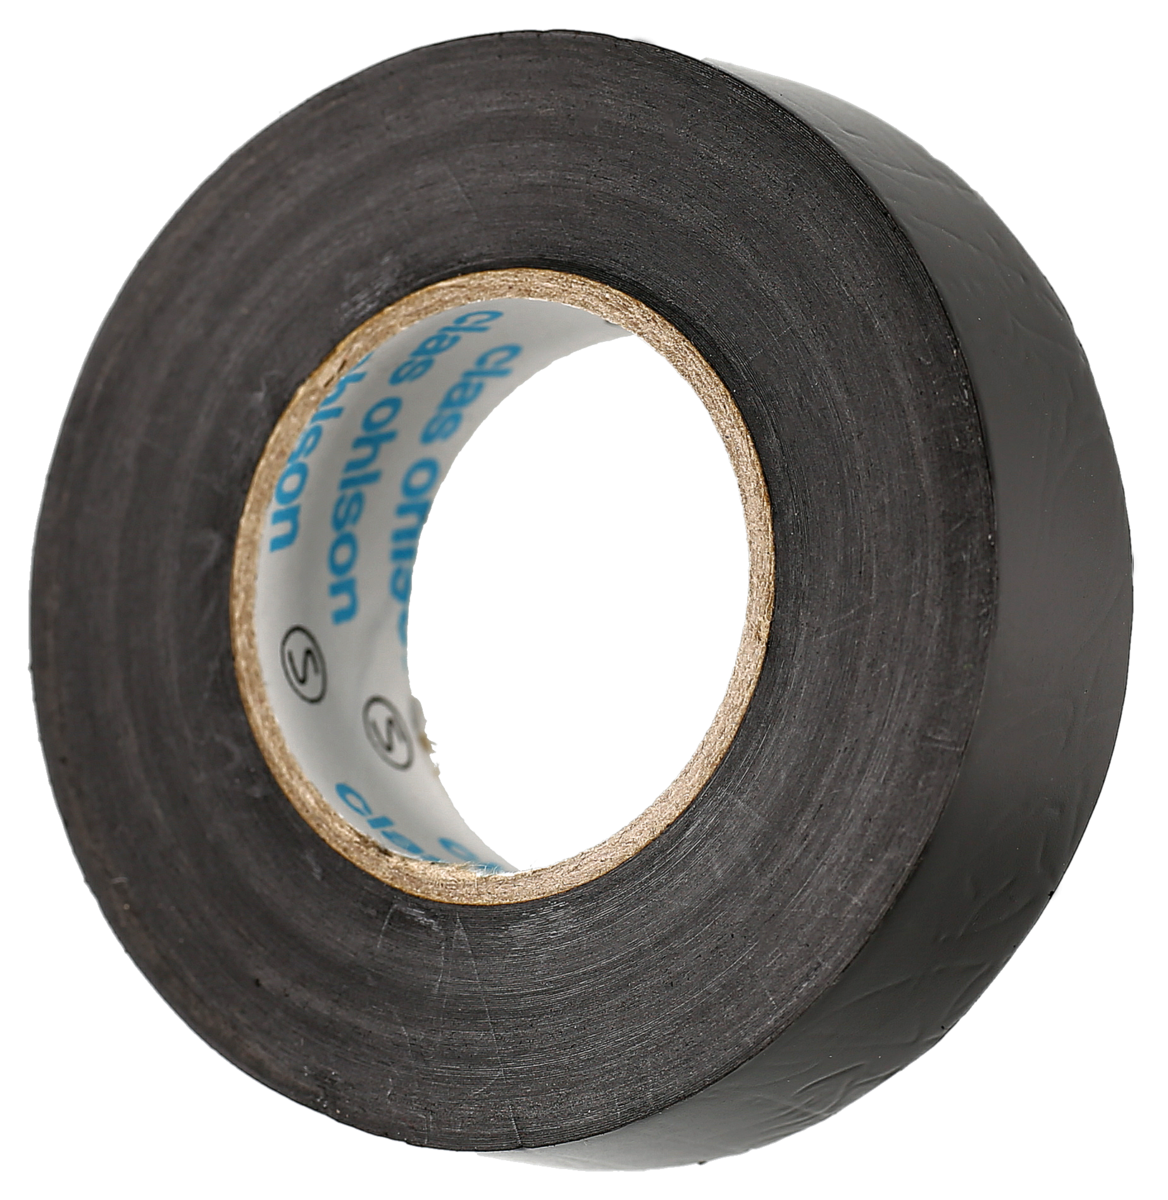|
|Wire Cutter|Needed to cut wires and strip cables.|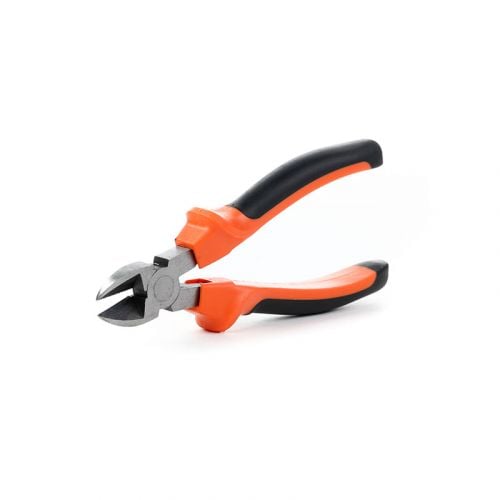
|Soldering Kit|Needed to solder connections for the pump circuit.||
|Multimeter|Needed to troubleshoot connections.|||
|Small Precision Screwdriver kit|Needed for relay connection and accessing the battery compartment of the battery holder.||
|6MM Drill Bit|Needed for drilling holes for the water hose and water pump cables in the reservoar.||
|Electric Screwdriver|For drilling|
---
## Computer, LoPy4 & Raspberry Pi 4 Setup
This project was built using Ubuntu 20.04LTS, and the tutorial will show the steps for this OS.
### Part 1 - LoPy4 Firmware Upgrade and IDE Setup
:::info
This part describes the setup of the microcontroller and the development environment. This will allow you to start programming the controller and upload your project to the device.
:::
1. Download the dialog and python-serial package by running these commands in the terminal:
```sudo apt install dialog```
```sudo apt install python-serial```
The dialog package allows for shell scripts to display helpful dialog boxes to the user, and the python-serial package provides encapsulated access to the serial ports for Python. Both packages are needed to use the pycom firmware upgrade utility.
2. Download the [PyCom Firmware Tool](https://software.pycom.io/downloads/pycom-fwtool-1.16.5-bionic-amd64.deb) and install it:
```sudo apt install ./pycom-fwtool-1.16.5-bionic-amd64.deb```
3. Connect your LoPy 4 to the expansion board, lining up the pins to match the board - with the led and reset button towards the micro usb port. A clear click should be heard.
4. Connect your LoPy 4 device and expansion board to the computer using an **USB 2 port with data transfer** and the micro usb cable. **Do not use an USB hub**. The device should be visible in the list provided by the command: ```lsusb```
5. The device should be located as a serial port device under ```/dev/ttyACM0```. By default, this newly connected device belongs to the **dialout** group, and your used needs to be added to it:
```sudo usermod -a -G dialout [YourUserName]```
You need to relog for the changes to apply. To ensure read and write access to the device, it is also sometimes necessary to add read/write access to the serial port device for all users:
```sudo chmod a+rw /dev/ttyACM0``` **Always run this command after reconnecting the device.**
6. Follow the [Updating Device Firmware](https://docs.pycom.io/updatefirmware/device/) guide and make sure to:
* Select the latest LTS release of Pybytes
* **Uncheck** "Force update Pybytes", "Enable Pybytes/SmartConfig support" since we will not use it
* Select File System: FatFS
* **Check** "Erase during update", RESET: "CONFIG partition" and "NVS partition". This is important to get a clean firmware flash and avoid any booting/connection/writing issues.
7. Make sure to get a successful message, else repeat steps 3-6 until successful.
8. Install [Atom](https://atom.io/) and the [Pymakr plugin](https://atom.io/packages/pymakr) by going to settings > Install > search for Pymakr and click install. Pymakr adds a REPL (Read, Evaluate, Print - Loop) console which connects to the flashed MicroPython firmware on the LoPy4 and allows you to run Python code, and upload your project code to the device.
9. Create a new project folder and open Atom and Pymakr. Reconnect your LoPy4, and it should automatically be recognised by the Pymakr plugin. You should now be able to run Python code in the console and upload project code to the device.

---
### Part 2 - Raspberry Pi 4 Linux Server Setup
:::info
This part describes the setup of the backend server which will host the database and web UI.
:::
1. Download and install the [Raspberry Pi Imager](https://www.raspberrypi.com/software/):
```sudo apt install ./imager_1.7.2_amd64.deb```
2. Connect your Micro-SD card using the Micro-SD reader and run the Raspberry Pi Imager from the applications menu. Select Raspberry Pi OS Lite (64-bit) which is essentially a headless Debian build.

3. Go into advanced options:
* **Check** "Enable SSH" and "Use password authentication"
* Configure a **username** and a **password**
* **Check** "Configure wireless LAN" and enter your WiFi information.
This will allow the device to automatically connect to your local wireless LAN, and allow you to instantly access the device using **SSH**.
4. Select the Micro-SD card and press **WRITE**.
5. When the installation is finished, eject the Micro-SD reader, plug the Micro-SD card into the Raspberry Pi 4, and deploy the device. It should now be up and running and ready to be accessed by **SSH**.
6. Open up a web browser and [access your router settings](https://www.lifewire.com/accessing-your-router-at-home-818205). Navigate to your connected devices and find your Raspberry Pi 4, and give it a static local IP address. This will make it easier to access the device and ensure reliable connectivity.
7. Open a terminal and use the command:
```ssh USERNAME_FROM_STEP_3@RPI4_LOCAL_IP_ADRESS ```
for example
```ssh raspberrypi4@192.168.1.3```
8. Enter the password from step 3 and you should be allowed into the system:

9. Update the system: ```sudo apt update && sudo apt upgrade -y```
10. Install the text editor Vim to be able to edit text files in the later steps. For a cheat sheet on how to use this text editor see [this cheat-sheet](https://vimsheet.com/).
```sudo apt install vim```
---
## Part 3 - Docker setup
:::info
This part describes the setup of Docker, which will be used to run the TIG-Stack: the Telegraf Server Agent used to collect data, InfluxDB which is the database storing the data, and Grafana which is the analytics service with a web UI for monitoring the database.
:::
1. Install the Docker Engine, CLI, Container daemon and Docker Compose using the [Docker Convenience Script](https://docs.docker.com/engine/install/debian/#install-using-the-convenience-script) which is the easiest way for Raspbian OS:
```curl -fsSL https://get.docker.com -o get-docker.sh```
then
```sudo sh get-docker.sh```
If successful, the docker service should be up and running. Check with:
```systemctl status docker```

**Now you should be ready to build, configure and deploy the system.**<br><br>
## Putting Everything Together
### The circuit

This is the circuit for the project. The wires from the expansion board are a combination of 2x Male-Female and 1x Male-Male jumper wires for extra length, and the wires on the breadboard are Male-Male.
The connections from the battery pack and the pump needed to be soldered.
I chose to solder on a Male jumper wire end on both **+ (Red)** and **- (Black)** on the pump, a Male end on the battery pack **- (Black)** and a Female end on the battery pack **+ (Red)**.
The wires are cut, stripped, twined, soldered and then taped with electrical tape.
#### **Soldering setup**

#### **Soldering a Male jumper wire end to the battery pack -**

#### **Soldering a Female jumper wire end to the battery pack +**
The copper wire on the water pump is very thin, and is easily burned off. What worked best was to use flux, and a lower temperature on the soldering iron - and gradually heat the wire for a longer duration instead.

The FC-28 sensor was splashproofed using electrical tape. The connections and the ends of the jumper cables were sealed off. **Note: This will not save the sensor from a flooding of the pot. Just against splashes from watering.**

This is the reservoar with the pump submerged inside. The two holes for the hose and the wiring was drilled.

The pump circuit, controlled by the relay.

## Electrical Calculations
### Data
*Values based on a supply voltage of 5V*.
*Where no average data available, the maximum value has been used*.
|Component|Mode|Current Draw|
|----|----|----|
Microcontroller (LoPy4)|<ul><li>Active (WiFi client)</li><li>Light Sleep (WiFi Off)</li></ul>|<ul><li>107mA</li><li>30mA</li></ul>|
|MCP9700E|<ul><li>Active</li></ul>|<ul><li>6µA</li></ul>
DHT-11|<ul><li>Measure</li><li>Sleep</li></ul>|<ul><li>2.5mA</li><li>150µA </li></ul>|
|Photoresistor|<ul><li>Active</li></ul>|<ul><li>3.3mA*</li></ul>
|FC-28|<ul><li>Measuring</li><li>Off</li></ul>|<ul><li>35mA</li><li>0mA</li></ul>
|3V Submersible pump|<ul><li>On</li><li>Off</li></ul>|<ul><li>150mA*</li><li>0mA</li></ul>
|5VDC Relay|<ul><li>On</li><li>Off</li></ul>|<ul><li>150mA</li><li>0mA</li></ul>
*Data Sources:* [LoPy4 Data Sheet](https://docs.pycom.io/gitbook/assets/specsheets/Pycom_002_Specsheets_LoPy4_v2.pdf), [DHT11 Data Sheet](https://www.electrokit.com/uploads/productfile/41015/DHT11.pdf), [MCP9700 Data Sheet](https://www.electrokit.com/uploads/productfile/41016/2243473.pdf), [Dual Comparators Data Sheet](https://www.ti.com/lit/ds/symlink/lm393-n.pdf), [SRD-05VDC-SL-C Data Sheet](https://www.circuitbasics.com/wp-content/uploads/2015/11/SRD-05VDC-SL-C-Datasheet.pdf)
1* 3.3V, 1000ohm -> 0.01089W
3.3V, 0.01089W -> 0.0033A draw -> 3.3mA (Approximated)
2* Approximated from similar pumps
The system uses periodic sampling which is good because it's simple and sends data in regular intervals. It might however send duplicate data if nothing in the environment has changed, which is a waste of energy.
Based on timing measurements and estimations of current draw - the different system cycles and their current draw are the following:
**Boot cycle:**
Time: 2s
Current draw:
30mA(LoPy4) + 6µA(MCP9700E) + 150µA(DHT-11) + 3.3mA(Photoresistor) = 33.456mA
**Setup cycle:**
Time: 3s
Current draw:
107mA(LoPy4) + 6µA(MCP9700E) + 150µA(DHT-11) + 3.3mA(Photoresistor) = 110.456mA
**Main cycle:**
Time: 4s
Current draw:
107mA(LoPy4) + 6µA(MCP9700E) + 2.5mA(DHT-11) + 3.3mA(Photoresistor) + 35mA(FC-28) = 147.806mA
(Assuming all sensors are measuring for the full duration of the cycle - not realistic but better to make a high estimate.)
**Pump cycle:**
Time: 5s if activated
Current draw:
150mA (Pump) + 150mA (Relay) = 300mA from 2xAA
**Light sleep cycle:**
Time: 300s
Current draw:
30mA(LoPy4) + 6µA(MCP9700E) + 150µA(DHT-11) + 3.3mA(Photoresistor) = 33.456mA
**Standby after sleep cycle:**
Time: 5s
Current draw:
107mA(LoPy4) + 6µA(MCP9700E) + 150µA(DHT-11) + 3.3mA(Photoresistor) = 110.456mA

The total power consumption for one full cycle can be calculated as:
$$ {33.456mA * 2s + 110.456mA * 3s + 147.806mA * 4s + 300mA * 5s + 33.456mA * 300s + 110.456mA * 5s}$$
$$ = $$
$$ 13078.584mAs \approx 3.6mAh$$

The total power consumption for one **actual** main/sleep cycle (Excluding the boot, setup and pump cycles) can be calculated as:
$$ {147.806mA * 4s + 33.456mA * 300s + 110.456mA * 5s}$$
$$ = $$
$$ 11180.304mAs \approx 3.1mAh$$<br>
---
### Duty cycle

*Source: [Prof. Dr. Anna Förster - Energy in IoT]()*
The duty cycle of the main system loop, excluding the initial boot and setup cycle can therefore be calculated as:
$$ {4s + 5s \over 4s + 5s+ 300s} = 0,029126214 \approx 3\% $$
A duty cycle of **3%** is a bit high, and in production systems it is common to aim for a duty cycle of **<1%**. However, for a bit of responsiveness I felt that a data transmission each 5 minutes could be appropriate. Since the system, excluding the pump circuit, runs on wall power, battery life is also not an issue.
---
### Example of system lifetime on battery power
If the system is powered by a 10000mAh power bank (Giving 80% of its capacity because of battery characteristics / loss of efficiency) the system lifetime can be estimated as:
$$ {(10000mAh * 0.8) \over 3.1mAh} = 2580.64516129 \approx 2580\space Cycles$$
This gives
$$ 2580 \space Cycles = 2580 * 309 \space Seconds \approx 221 \space Hours$$<br>
If the pump circuit is powered by 2x2000mAh AA batteries, it's lifetime can be estimated as:
$$ {2000mAh \over 0.42mAh} = 4761,904761905 \approx 4761\space Cycles$$
Since the pump circuit is only activated when the plant is almost completely dry, it's safe to assume the system will not be bottlenecked by the lifetime of the pump batteries.<br><br>
When using [This popular IoT LiPo Battery Life calculator](https://www.of-things.de/battery-life-calculator.php) and plugging in the values:
**Duration of code execution:** 9s (Main + Standby cycle)
**Sleep time:** 300s (Sleep cycle)
**Consumption during code execution:** (147.806 + 110.456) / 2 = 129.131mA (average between Main and Standby)
**Consumption in sleep mode**: 33.456mA
The result is **~220 hours**
This gives some indication that the estimations above are in the right ballpark.<br><br>
The battery life of the system could also be dramatically improved by increasing the sleep cycle and reducing the frequency of measurements and transmissions.
---
### About energy modeling

*Source: [Prof. Dr. Anna Förster - Energy in IoT]()*
As displayed in the picture above and discussed in the video, studies have shown that the theoretical estimates of IoT system lifetimes are **significantly much higher** then the real world resulting lifetimes. This indicates that you should always take these estimates as an optimistic estimate, and make sure to have margins in your power strategy - since the actual battery life will be much lower.<br><br>
## Platform
In this project, we are using **Adafruit IO** for its service as an MQTT broker. This is a cloud provider that will allow the system to expand by opening up the possibility of additional subscribers/publishers to the system. For example you can set up another microcontroller with sensors at another location and publish its data to Adafruit, and have this data accessible on the TIG-stack back end. You can also for example allow your friends to subscribe to your data feed, so they also can set up a monitoring solution and monitor the same data.
### Choice of database
We are using **InfluxDB** as the database manager, since it is made specifically for time series data. Since it's a relation-ish system with the query language InfluxQL (SQL Dialect) it's easy to get started with if you have some knowledge of relational databases. Using **Telegraf**, which plays well with both InfluxDB and Grafana, as an agent for collecting the data over MQTT makes the data collection very easy.
**Grafana** is very easy to configure, and InfluxDB can easily be added as a data source. Collects data from the database using InfluxQL/Flux queries which you can write yourself or build from a gui tool. Easy to build and customize dashboards according to your needs, and very easy to set up webhooks for alerting.
Using these services together with **Docker-compose** really makes deploying and configuring this TIG-stack very easy. I also wanted to explore docker, use my linux background with self hosting and make the system scalable.<br><br>
## The Code - MicroPython project and TIG-stack
The code can be downloaded from [Github](https://github.com/SamuelThand/Automated-Plant-Monitoring-System).
---
### Lopy4
The structure of the MicroPython project

The files located in the lib directory are libraries(drivers) for different aspects of the project.
[Connections.py](https://github.com/SamuelThand/Automated-Plant-Monitoring-System/blob/main/micropython-project/lib/connections.py) is my own library which handles WLAN and MQTT connections.
[errno.py](https://github.com/SamuelThand/Automated-Plant-Monitoring-System/blob/main/micropython-project/lib/errno.py) is constants for different error codes related to MQTT connections.
[keys.py](https://github.com/SamuelThand/Automated-Plant-Monitoring-System/blob/main/micropython-project/lib/keys.py) is where WLAN and MQTT credentials are stored. (Not a secure solution for a production system, but fine for an isolated device inside a home network with no sensitive data)
[dht.py](https://github.com/SamuelThand/Automated-Plant-Monitoring-System/blob/main/micropython-project/lib/dht.py) is a driver for the DHT-11 sensor, which provides functionality for processing and interpreting the digital signals from the sensor.
[simple2.py](https://github.com/SamuelThand/Automated-Plant-Monitoring-System/blob/main/micropython-project/lib/simple2.py) and [robust2.py](https://github.com/SamuelThand/Automated-Plant-Monitoring-System/blob/main/micropython-project/lib/robust2.py) are MQTT drivers, where simple2 provides a barebones MQTT client, and robust2 provides extra functionality such as reconnection handling.
[boot.py](https://github.com/SamuelThand/Automated-Plant-Monitoring-System/blob/main/micropython-project/boot.py) gets executed when the device is booted, and simply calls the wlan_connect function using the credentials stored in keys.
The operation is also timed for metrics.

[main.py](https://github.com/SamuelThand/Automated-Plant-Monitoring-System/blob/main/micropython-project/main.py) is the main program for the device, which contains the **setup** and **main** cycle.
The setup part can be seen below. Necessary imports are made, including the **pycom** module for accessing device features such as the embedded LED for status indications, the **time** module for halting execution, the **Pin** module for defining pin functionality, **ADC** for analog-digital conversion from the analog sensors, and **machine.sleep** for access to a light sleep mode which disables the WLAN connection and other parts. **json** is imported in order to format the data to be transmitted as JSON.
The setup cycle is then timed, two **adc-channels** are set up to process analog signals, and the connections for all the sensors, the separate power supply to the moisture sensor and the pump relay are defined. Finally an MQTT connection is established to the Adafruit MQTT broker.

This is followed by function definitions for the sensor measurements and the activation of the water pump.

The temperature and light sensors are analog, which means that a voltage reading is taken. Depending on the resolution of the ADC channel, you will get a certain binary value. In **measure_light()** For example, the resolution is 10 bits - which means a reading from 0 - 1024 is possible. On this voltage, you then need to apply an equation to extract the metric of interest. These equations are (hopefully) available in the datasheet for the sensor. This is the equation for the MCP9700 temperature sensor extracted from the datasheet:

For the light sensor, a calculation is made to extract the light percentage value. The value from this sensor is not a linear value, and not tied to an SI unit - so you can only extract a relative value from it - that's why a percentage can be appropriate. There is no equation yielding a result of a certain unit like above.
The same principle is applied in the **measure_soil_moisture()** function since that sensor is also analog. This sensor however also takes damage from a constant voltage supply, which means you need to power it only when measuring in order to preserve its lifetime. The sensor is powered, then execution halted in order to make sure it's sufficiently powered, a reading is taken and then it is unpowered.
The humidity sensor is digital, and the **read()** method from its driver can be employed directly to extract a useful value.
The **water_plant()** function simply issues a high control signal, which closes the relay and activates the pump circuit, waits five seconds and then issues a low control signal which opens the circuit. The result is pumping water into the plant for 5 seconds.
Then follows the definition for two reconnection functions. **connect_wlan_adafruit()** lights the device LED **yellow** in order to notify that there has been a WLAN connection issue, and makes a new fresh wlan connection, followed by a new adafruit connection.
**reconnect_adafruit()** lights the device LED **green** in order to notify that there has been an MQTT connection issue, and then tries to reconnect and reestablish the connection.

Then follows the definition of the main function, which constitutes the main loop cycle.
First, the connections are tested - and re established if there are any issues. The **LED blue heartbeat** is activated to indicate that the main cycle is running. The MQTT message queue is checked and sent, then readings are collected from all sensors, sensor data is formatted as a JSON object and published to Adafruit. Since the DHT11 digital sensor is highly based on signal timing, the reading can sometimes be corrupted with data loss or checksum errors. If this occurs, the error code is printed and the exception is handled.

Finally the plant is watered if the soil is very dry.

This is the loop which drives the system. The sleep cycle can easily be adjusted by increasing/decreasing the time in the **sleep()** function. The **True** argument re-enables the WiFi module after sleeping, and a small execution halt of 5 seconds ensures the connection is properly established before commencing the next cycle.

---
### Get data transmission from LoPy4 to Adafruit running
**First:** Make sure you have completed the setup and connected the system correctly.
1. Create an account on [Adafruit](https://io.adafruit.com/), setup a [feed](https://learn.adafruit.com/adafruit-io-basics-feeds) and locate your Adafruit Username and Key from the navigation bar.
2. Download the code from the link above, and save it in a folder.
3. Open the folder as an Atom project **File -> Open Folder**
4. Edit the code in connections, keys, main with your own WiFi and Adafruit information, and save.
5. Connect your device and upload the project code using the **"Upload project to device"** button in the Pymakr console.
6. Let the program run, and you should receive data on your Adafruit feed.

<br><br>
### Get TIG-stack on the Raspberry Pi 4 running
The docker-compose, and telegraf.conf files can be downloaded from [Github](https://github.com/SamuelThand/Automated-Plant-Monitoring-System).
---
**First:** Make sure you have completed the setup and connected the system correctly, and have your LoPy4 up and running transmitting data to Adafruit.
1. SSH into your Raspberry pi 4.
```ssh USERNAME_FROM_SETUP_STEP_3@RPI4_LOCAL_IP_ADRESS ```
<br>
2. Make a new directory for the TIG-stack and go to it
```mkdir tig-stack```
```cd tig-stack```
<br>
3. Download the files to this directory
```wget ADRESS```
```wget ADRESS```
<br>
4. Open docker-compose.yml using Vim
```sudo vim docker-compose.yml```
By default the volume "tig-data" will be created on the host machine, where all data for the tig stack will be stored. There will also be volumes created in each container as listed under services -> volumes behind the **:**

Edit the information under **INFLUX_DB**, **INFLUXDB_ADMIN_USER**, **INFLUXDB_ADMIN_PASSWORD** to desired information.

Edit the information under **GF_SECURITY_ADMIN_USER**, **GF_SECURITY_ADMIN_PASSWORD** to desired information.

Edit the information under **DATABASE** to match the **INFLUXDB_DB** information.
The containers that will be started from this docker-compose should now be properly configured and connected to each other.
**Save and exit.**
<br>
5. Open telegraf.conf using Vim
```sudo vim telegraf.conf```

[[inputs.mqtt_consumer]] :
Edit the information under **topics** to match your adafruit username. The /feeds/# will ensure telegraf grabs all your feeds.
Edit the information under **username** to match your adafruit username, **password** to match your **adafruit key**
[[outputs.influxdb]]
Edit the information under **database** to match the **INFLUXDB_DB** information from docker-compose.yml
Edit the information under **username** to match **INFLUXDB_ADMIN_USER** and **password** to match **INFLUXDB_ADMIN_PASSWORD** from docker-compose.yml
Telegraf should now be configured to collect the last data from all your Adafruit feeds every 15s using MQTT, and send this data to the influxdb database.
**Save and exit.**
<br>
6. Now you're ready to deploy the TIG-stack.
From the tig-stack directory, run:
```sudo docker compose up -d```
Docker will now pull the containers, configure and deploy them daemonised (They will run in the background).

Verify that the containers are up and running using
```sudo docker ps```

<br>
7. Now you can check that InfluxDB is indeed collecting data from adafruit.

Verify that your LoPy4 is up and running, and transmitting data to your Adafruit feed. Wait a few cycles so that some data has been transmitted.
Open a shell into the influxdb container using
```sudo docker exec -it influxdb bash```
Enter database using
```influx```
Authorize yourself
```auth```
Enter your username and password
Display the databases
```show databases```
Use your database
```use yourdatabase```
Write an InfluxQL query counting the stored tuples, like for example
```SELECT count(Plant_sensor_tempsensor) FROM Adafruit```
Verify that there is indeed some data stored.
**Press CTRL-D two times to exit back to the host shell**
<br>
8. Now you are ready to set up InfluxDB as a data source and visualize data in Grafana.
Navigate to your browser and enter
```RPI4_LOCAL_IP_ADRESS:3000```
for example
```192.168.1.5:3000```
And you will enter the Grafana web UI.

Follow the guide for [adding a data source](https://grafana.com/docs/grafana/next/administration/data-source-management/)

Select **InfluxDB** in the menu.

Enter the following configuration details:

Enter your your information matching the docker-compose info **INFLUX_DB** for Database,, **INFLUXDB_ADMIN_USER** for User and **INFLUXDB_ADMIN_PASSWORD** in the Password field.

**Click Save & Test and it should return the following**

Now the TIG stack should be up and running - Telegraf is collecting data over MQTT and sending it to InfluxDB, and Grafana can directly query the Influx database using InfluxQL.<br><br>
## Transmitting the data / connectivity
### Data Transmission, Wireless Protocols, Transfer Protocols
The data is transmitted once every 5 minutes from the LoPy4 over the internet to Adafruit, which Telegraf collects every 15s. Grafana queries InfluxDB every time you manually refresh the panel, or according to the chosen auto refresh interval.
The wireless protocol I use is WiFi - IEEE 802.11n on 2.4GHz which is a pretty old standard approved in 2009. The reason for this is that I have no fiber internet at home, and use an older 4G router without support for these newer protocols. :cry:
The LoPy4 sends, and the Raspberry Pi 4 receives data over MQTT.
---
### Elaboration - Data transmission, Wireless Protocols

*Source: [Marco Zennaro, Research Scientist - Connectivity in IoT](https://www.youtube.com/watch?v=uUVKWt4NKUo)*
The lower limit for data transmission does not create an obstacle for this system though, since the data size is so small.

*Source: [Marco Zennaro, Research Scientist - Connectivity in IoT](https://www.youtube.com/watch?v=uUVKWt4NKUo)*
As can be seen on this picture, the range of WiFi is pretty limited, and battery consumption is also higher. If this system was to be deployed outside of the home where there is no WiFi connectivity, a better solution would be using an **LPWAN(Low Power, Wide Area Network)** such as **LoRa**.

*Source: [Marco Zennaro, Research Scientist - Connectivity in IoT](https://www.youtube.com/watch?v=uUVKWt4NKUo)*
From this image it can be seen that LoRa has a much higher range than WiFi, as well as a much lower battery consumption - Which makes it ideal for an IoT system that periodically transmits small data.
However, since the system is currently deployed inside the home - running on AC wall power and WiFi is the obvious solution. Since LoRa coverage is scarce at my location it's also not ideal, if you don't want to run your own Helium Gateway for example.
The frequency of data transmission is also something that would need consideration if the system were deployed outside. Do you really need new data each 5 minutes? Perhaps it would suffice with a transmission each hour - which would drastically improve battery life. However - Since the system is currently deployed at home, there is no need to be nitpicky about this.
---
### Elaboration - Transport Protocols
The LoPy4 transmits data to Adafruit as a publisher using the MQTT protocol, which runs upon the TCP/IP network stack. Since MQTT has smart functionality for message retention, distribution and queuing it requires a lossless transport protocol, which in my case is TCP. MQTT also provides some security, since the MQTT topics are locked behind a key and username.
The Raspberry Pi4 running the TIG-stack uses the MQTT protocol as a subscriber to access the data from the feed.
Webhooks are in my case used from Grafana to post alerts to Discord. A webhook is an HTTP callback in the form of an HTTP POST request, that is executed when a certain condition is filled, in my case it can be if the data shows that the temperature exceeds 30C for a period, that the room is too humid, the plant is too dry etc. The effect is that a message is sent from a Discord bot, to my discord server chat, with my specified alert message for that condition.

Using an MQTT broker is a really good way of making the IoT system scalable, you can add new devices that publishes data, you can add new subscribers that receives data. You can move your LoPy4 setup to another location and still store and visualize the data at your home server. I first thought about hosting my own MQTT broker, or even skipping the use of MQTT. But after some research I felt this was the best choice by far.
## Presenting the data

This is the main view of the dashboard, where you have 4 gauges giving the last reading from each sensor. Note that the temperature has exceeded the accepted threshold of 30 (It was very warm in the apartment) and the brightness has spiked at 100%. This is illustrated by the red colors.
There are also 4 panels with graphs displaying the measured data over time, so you can analyze it over different time periods. (This picture shows over a 6h time span) The lines intersecting the graph are when tests for alert conditions have been executed. Since both brightness and temperature had exceeded the trigger conditions, I received two alerts on my Discord server:


And once the temperature had sunk to acceptable levels:

---
### Choice of database
For elaboration on this - see subheading under **Platform**
The data is transmitted once every 5 minutes from the LoPy4 over the internet to Adafruit, which Telegraf collects every 15s. Grafana queries InfluxDB every time you manually refresh the panel, or according to the chosen auto refresh interval.
On Adafruit, the data is stored for 30 days, and on InfluxDB the retention policy is left as default - which means the data will be stored forever.
I have a MicroSD card of 128GB on the Raspberry Pi, which is a huge size for this small data. Only a few KB of data has been stored after running this system for several days, which means the system lifetime would be bottlenecked by the SD card deteriorating from age before the storage would become full. This retention policy is not an issue in this case, but needs to be considered if the data is larger.
---
### Automations/triggers of the data
The automation of the watering of the plant is handled at the edge (in the LoPy4 device) instead of as a command issued from the backend. I felt it was easier to handle this simple logic of opening and closing a relay at the device, it also felt safer since you can hardcode the opening of the relay in order to prevent a flooding or some other catastrophic event. If the device would rely on remote commands for opening and closing the circuit, it's possible the pump could be left on. This automation can be seen under the heading **The Code**.
The triggers of the data consists of four different alerts:
If the temperature is higher than 30C
If the brightness is higher then 90%
If the humidity is below 20%
If the soil moisture is below 15%

*Temperature alert*
These alerts are useful, for example, if the plant is sensitive to temperatures over 30C, if it's not supposed to be standing in direct sunlight all summer, if it's sensitive to dry air or if the plant soil should "dry out" between watering.
These alerts are each tied to one of the grafana panels, and new triggers can be set up for different plants, depending on their unique needs.
If you for example added another set of sensors and a cactus to the system, you could create new monitoring panels for this cactus and set up alert triggers like:
If the temperature is lower than 20C
If the brightness is lower then 50% for 6 hours
If the humidity is above 50%
If the soil moisture is above 50% for 2 days
Grafana is very good and flexible for this type of monitoring.
---
### Get data visualisation with Grafana running
To setup a dashboard with panels and webhook alerts:
1. Log into the grafana web interface
2. Click **Create -> Dashboard** from the side menu
3. Click Add an empty panel

4. Name the panel after what you will be monitoring, and either click through the graphical tool to build an InfluxQL query for the value you want to monitor, or click the pen icon to **toggle text edit mode** to write it manually. Select a desired visualization model and click **Apply** in the top left corner.

The result can look like this:

5. Go through the settings for the panel and customize to your liking. The panels can then be stacked, rezised and fitted in the dashboard.
6. To setup a webhook for alerts, go to **Alerting -> Notification channels** from the side menu and click **New channel**
Then select your Type of channel (Discord, E-mail, Slack, Microsoft Teams etc.) and fill out the required information. Refer to the documentation of the software you want to use for how to generate and set up a webhook. Here is a resource for [Discord.](https://support.discord.com/hc/en-us/articles/228383668-Intro-to-Webhooks)
Click **Test** to send a test message to your channel.

7. To setup an alert, select the **Alert** tab in the panel you want configure, and fill out the configuration to your needs and select your newly created notification channel under **Send to**.

In this example, the trigger is evaluated every 2 minutes, and does so for 1 second.
The trigger condition is: If the latest value (Returned by the last() aggregate function) of query "B" between now and 5 minutes ago, is above 30.
Repeat these steps until you have created a dashboard with panels and alerts for all your needs.<br>
**Now you should have an automated plant monitoring system up and running!**
<br><br>
## Finalizing the design
Close up of the breadboard with the sensors and pump relay

Close up of the LoPy4

The Raspberry Pi 4 running the whole back end!

Monitoring on the MacBook

The Discord feed with alerts (Very hot and bright day)

The Workstation

---
### Thoughts
I had some pretty bad issues with firmware flashing of the LoPy4 initially, which took much time and caused much headaches. This was fixed by erasing all partitions and doing a really clean firmware flash. Some issues with serial-port connectivity also came up from nowhere in the middle of the project, requiring lots of special effort to connect and upload code to the device - something which really should be plug-n-play. (All these special steps are included in this tutorial).
There were also some issues with the DHT-11 sensor, which required some modification of libraries that should also have been plug and play. I also got defective sensors which needed to be reordered.
The PyCom documentation is unfortunately not so good, which also caused some unnecessary problems because of lack of clarity and intent in their code libraries and very thinly written documentation. I ended up using the robust2 mqtt library instead of Pycoms own library because it was so poorly written it was very impractical to program against, with totally 0 documentation.
These factors aside, I think the project went well over all. It was really fun to experiment and learn new things during the process.
---
## Video
{%youtube d-zP8-2sP0o %}
 Sign in with Wallet
Connect another wallet
Sign in with Wallet
Connect another wallet