# Case Study: Analytics in Education, Academic Success, Student Characteristics, and Early Grades
# Dataset
### Background and Source
This dataset comes from the UCI Machine Learning Repository. It was donated by Portuguese Researchers studying how to predict student outcomes based on student characteristics and grades. The dataset can be found [here](http://archive.ics.uci.edu/dataset/697/predict+students+dropout+and+academic+success).
Each sample in the dataset correspond to a students data. It contains features that describe the students background and demographic information, as well as a students academic data for their first two semesters. The data is collected from various higher education institutions.
### Size of the Dataset
The dataset has 4424 samples and 37 features (including the target feature).
### Features
1. **Marital Status** (*qualitative*): The students marital status
2. **Application mode** (*qualitative*): How the student applied to the school
3. **Application order** (*qualitative*): 1st choice up to 9th choice, the students application preference for the school they are enrolled in
4. **Course** (*qualitative*): the program/course they are enrolled in
5. **Daytime/evening attendance** (*qualitative*): whether or not the student attends daytime or evening classes
6. **Previous qualification** (*qualitative*): The educational background of the student before admission in the school
7. **Previous qualification (grade)** (*quantitative*): The grade of the student from their previous qualification
8. **Nacionality** (*qualitative*): The students nationality
9. **Mother's qualification** (*qualitative*): The mother's educational background
10. **Father's qualification** (*qualitative*): The father's educational background
11. **Mother's occupation** (*qualitative*): The mother's occupation
12. **Father's occupation** (*qualitative*): The father's occupation
13. **Admission grade** (*quantitative*): The student's admission grade
14. **Displaced** (*qualitative*): Demographic data, whether or not the student is displaced
15. **Educational special needs** (*qualitative*): Whether or not the student has educational special needs
16. **Debtor** (*qualitative*): Whether or not the student has loans
17. **Tuition fees up to date** (*qualitative*): Whether or not the student is up to date with their tuition fees
18. **Gender** (*qualitative*): The students gender
19. **Scholarship holder** (*qualitative*): Whether or not the student is a scholar
20. **Age at enrollment** (*qualitative*): The age of the student at enrollment
21. **International **(*qualitative*): Whether or not the student is an international student
22. **Curricular units 1st sem (credited)** (*quantitative*): The number of units credited from the students precious institution for the first semester
23. **Curricular units 1st sem (enrolled)** (*quantitative*): The number of units enrolled for the first semester
24. **Curricular units 1st sem (evaluations)** (*quantitative*): The number of units that have evaluations
25. **Curricular units 1st sem (approved)** (*quantitative*): The number of units that are approved at the end of the first sem
26. **Curricular units 1st sem (grade) **(*quantitative*): The students average grade for the first semester (0-20)
27. **Curricular units 1st sem (without evaluations)** (*quantitative*): The number of units that don't have evaluations
28. **Curricular units 2nd sem (credited)** (*quantitative*): The number of units credited from the students precious institution for the end semester
29. **Curricular units 2nd sem (enrolled)** (*quantitative*): The number of units enrolled for the second semester
30. **Curricular units 2nd sem (evaluations)** (*quantitative*): The number of units that have evaluations
31. **Curricular units 2nd sem (approved)** (*quantitative*): The number of units that are approved at the end of the second sem
32. **Curricular units 2nd sem (grade)** (*quantitative*): The students average grade for the second semester (0-20)
33. **Curricular units 2nd sem (without evaluations)** (*quantitative*): The number of units that don't have evaluations
34. **Unemployment rate** (*quantitative*): Unemployment rate for the of the students demographic
35. **Inflation rate** (*quantitative*): Inflation rate of the students country
36. **GDP** (*quantitative*): GDP of the student's country
37. **Target** (*qualitative*): Prediction target, corresponds to academic outcome, Graduated, Dropped our or Enrolled.
## Data Processing
##### Converting Numerical back to Categorical data
When inspecting the raw data, it shows that all of the datasets qualitative features are all encoded into numerical values. Most of these features are not ordinal so it doesn't make sense to keep these variables as numbers. The encoding also prevents anyone from easily understanding the dataset. If you want to check the actual values, you would have to mentally convert the encoding of each value. To fix this, all numerical values from qualitative features are decoded back to their actual categories. The descriptions from the dataset's page in UCI Machine Learning Repository was used as a guide to perform this decoding.
##### Filtering Out Students that are not enrolled in any units
The dataset includes students that are not enrolled in any units for either the first or second sem. As a result said students don't have meaningful academic information, their number of units and grades are set to zero. Keeping these values might also result in introducing outliers to the dataset, throwing of descriptive statistics and insights. Because of this it was decided that these samples will be excluded from the dataset. One hundred eighty samples were excluded with this filter.
##### Adding new features
A few new features were added to the dataset. These features are derived from the existing academic data features.
38. **Curricular units 1st sem (not approved)** (*quantitative*): Derived by subtracting **Curricular units 1st sem (approved)** from **Curricular units 1st sem (enrolled)**. These feature corresponds the the number of units that didn't end up getting graded. Either these units were dropped, marked incomplete, or etc.
39. **Curricular units 2nd sem (not approved)** (*quantitative*): Derived by subtracting **Curricular units 2nd sem (approved)** from **Curricular units 2nd sem (enrolled)**. These feature corresponds the the number of units that didn't end up getting graded. Either these units were dropped, marked incomplete, or etc.
40. **Total unapproved units** (*quantitative*): The sum of the two previously added features. It combines both 1st sem and 2nd sem unapproved units.
41. **Mean grade** (*quantitative*): The mean of the students **Curricular units 1st sem (grade)** and **Curricular units 2nd sem (grade)**. This new feature provides an overall view on the students early performance
## Descriptive Insights
##### Distribution of Mean Grades
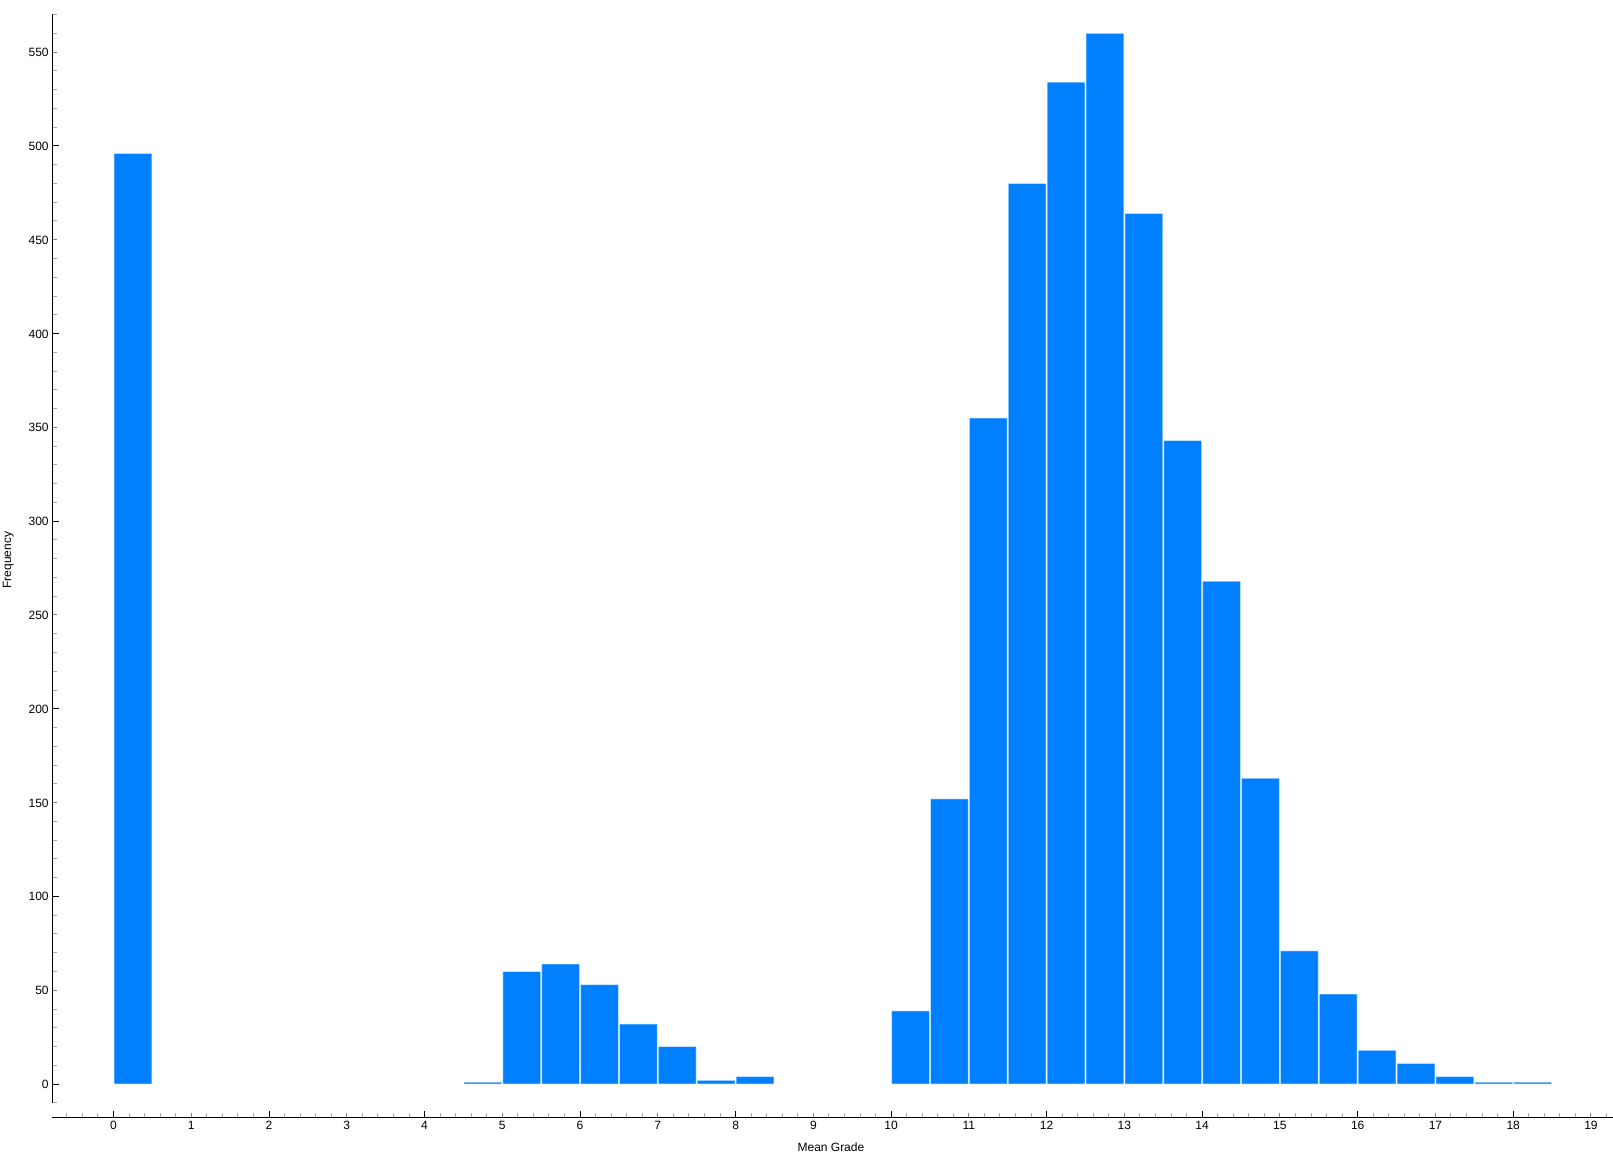
The chart above shows the distribution of mean grades. As seen here, mean grades grouped into three distinct groups, also known as a trimodal distribution. There is a large distribution of students that have a mean grade around 13, while there is also a significant number of students that end up with a mean grade of 0. But there is also a small but distinct group of students that have a mean grade of around 6.
##### Comparing Mean Grades and Student Gender
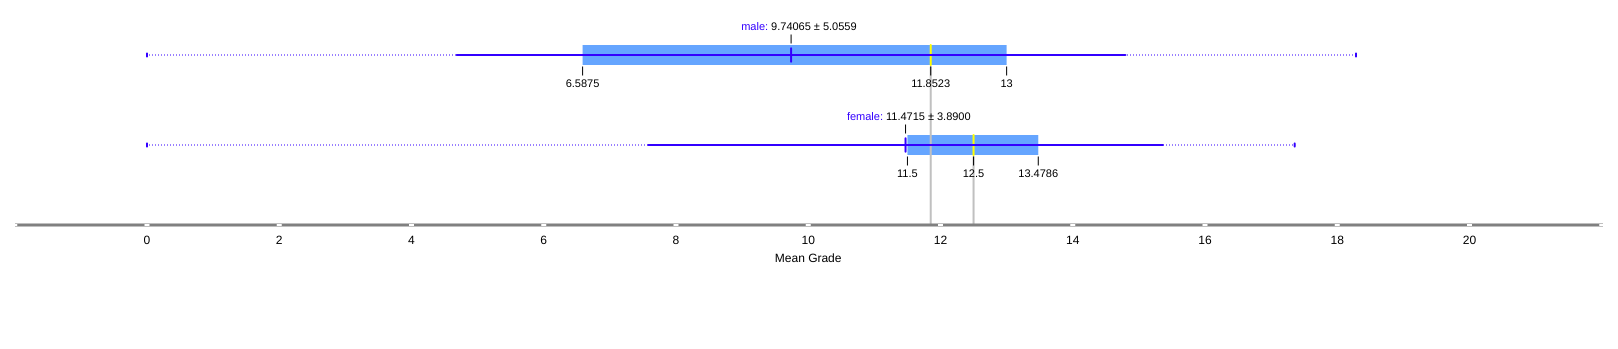
When comparing the grades of male students and female students, we can see that there is a noticeable difference between their descriptive statistics. Female students have a higher mean and median grade (11.47 and 12.5 respectively) while male students have a mean and median grade of 9.74 and 11.8. It is also interesting to see that while there are more female than male students, the the grades of male students are more dispersed with a stdev of 5.056 compared to the female students grades which has a stdev of 3.89.
##### Comparing Previous Qualification (grade) and Target (Academic Outcome)
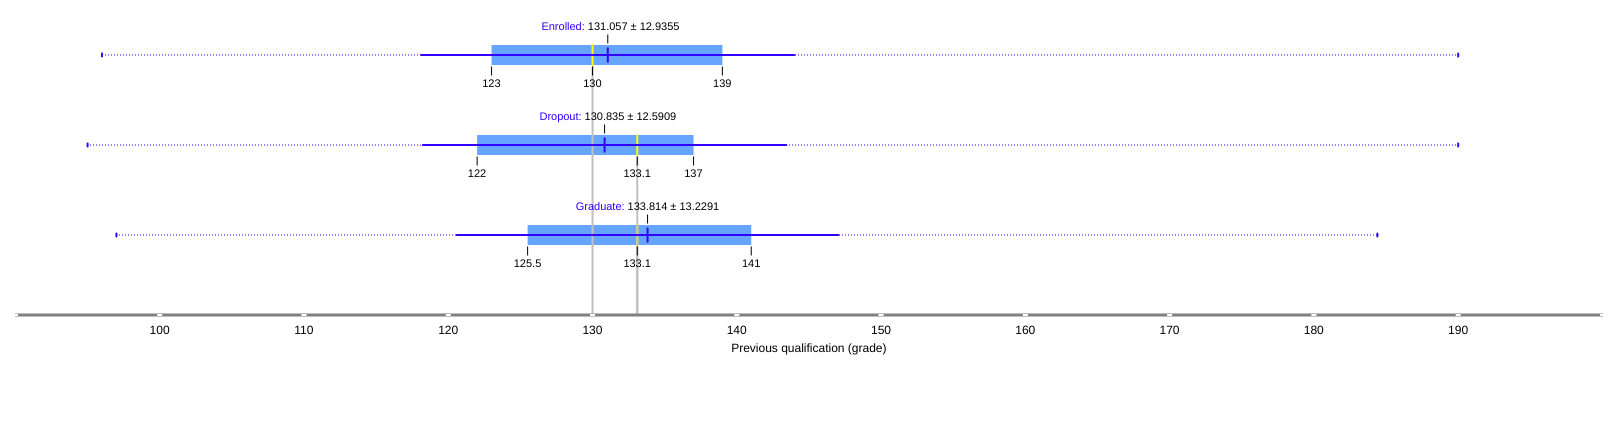
The previous qualification (grade), is the feature that describes the students grade from their previously attended school. It was checked whether theres a difference between the previous grades of students who end up graduating and students who end up dropping out. While theres some difference, the difference is very small. They have the same medians (133.1) and their means differ by about 0.8. This shows that the previous qualification grade of a student is not a strong indicator of a students academic outcome (whether a student graduates or drop out).
##### Comparing Mean Grades and Target (Academic Outcome)
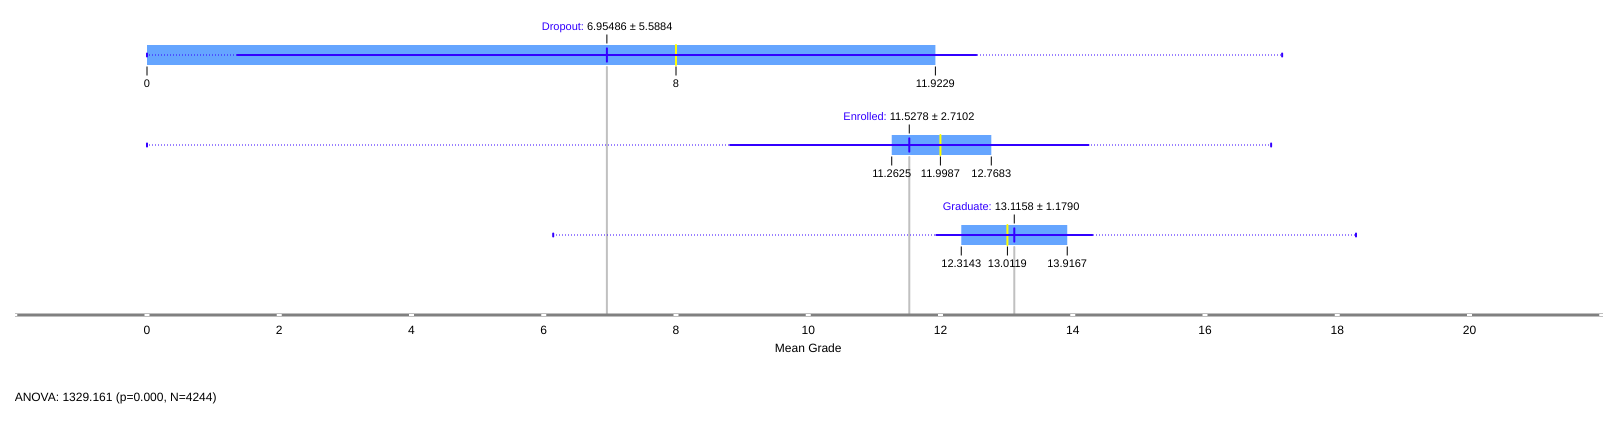
When comparing the mean grades of students who graduated and students who dropped out. We can see that students who end up dropping out tend to have lower grades for their first and second semester. This shows that the early grades of a student can be used to predict students that might drop out. This information can be used by the institution to identify early which students need academic intervention.
##### Comparing Total Unapproved Units and Target (Academic Outcome)
##### 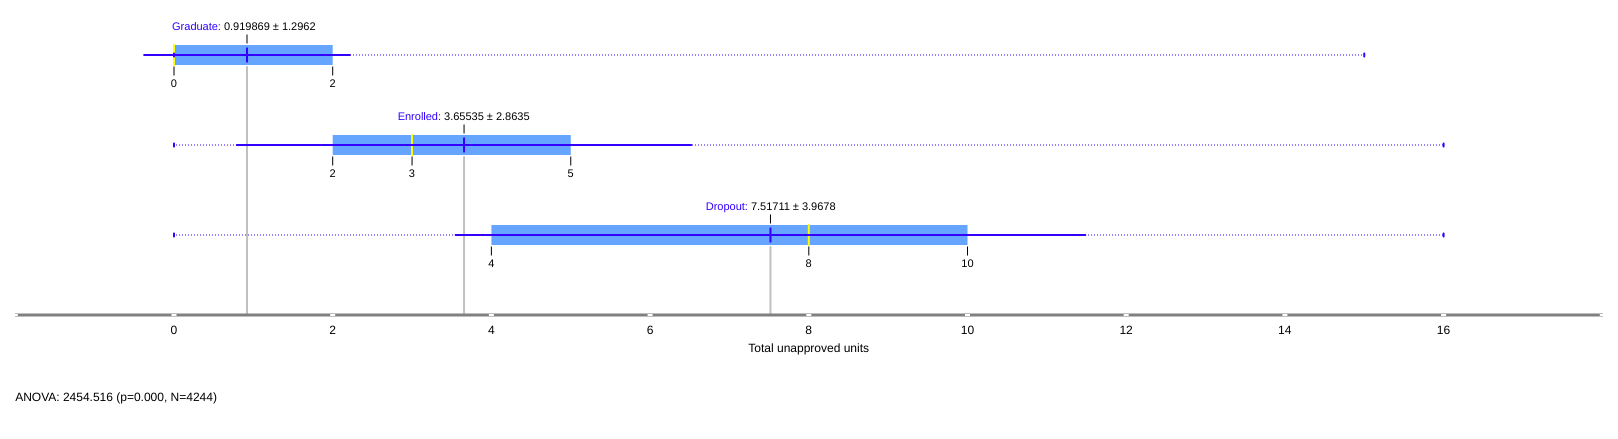
The Total Unapproved Units can also be a good indicator of a students academic outcome. Students show tend to have a lot of dropped subjects in first and 2nd semesters, are at risk of dropping out. Just like the Early grades, this feature can also be used to identify students that need academic intervention.
##### Comparing Previous Qualifications and Mean Grade
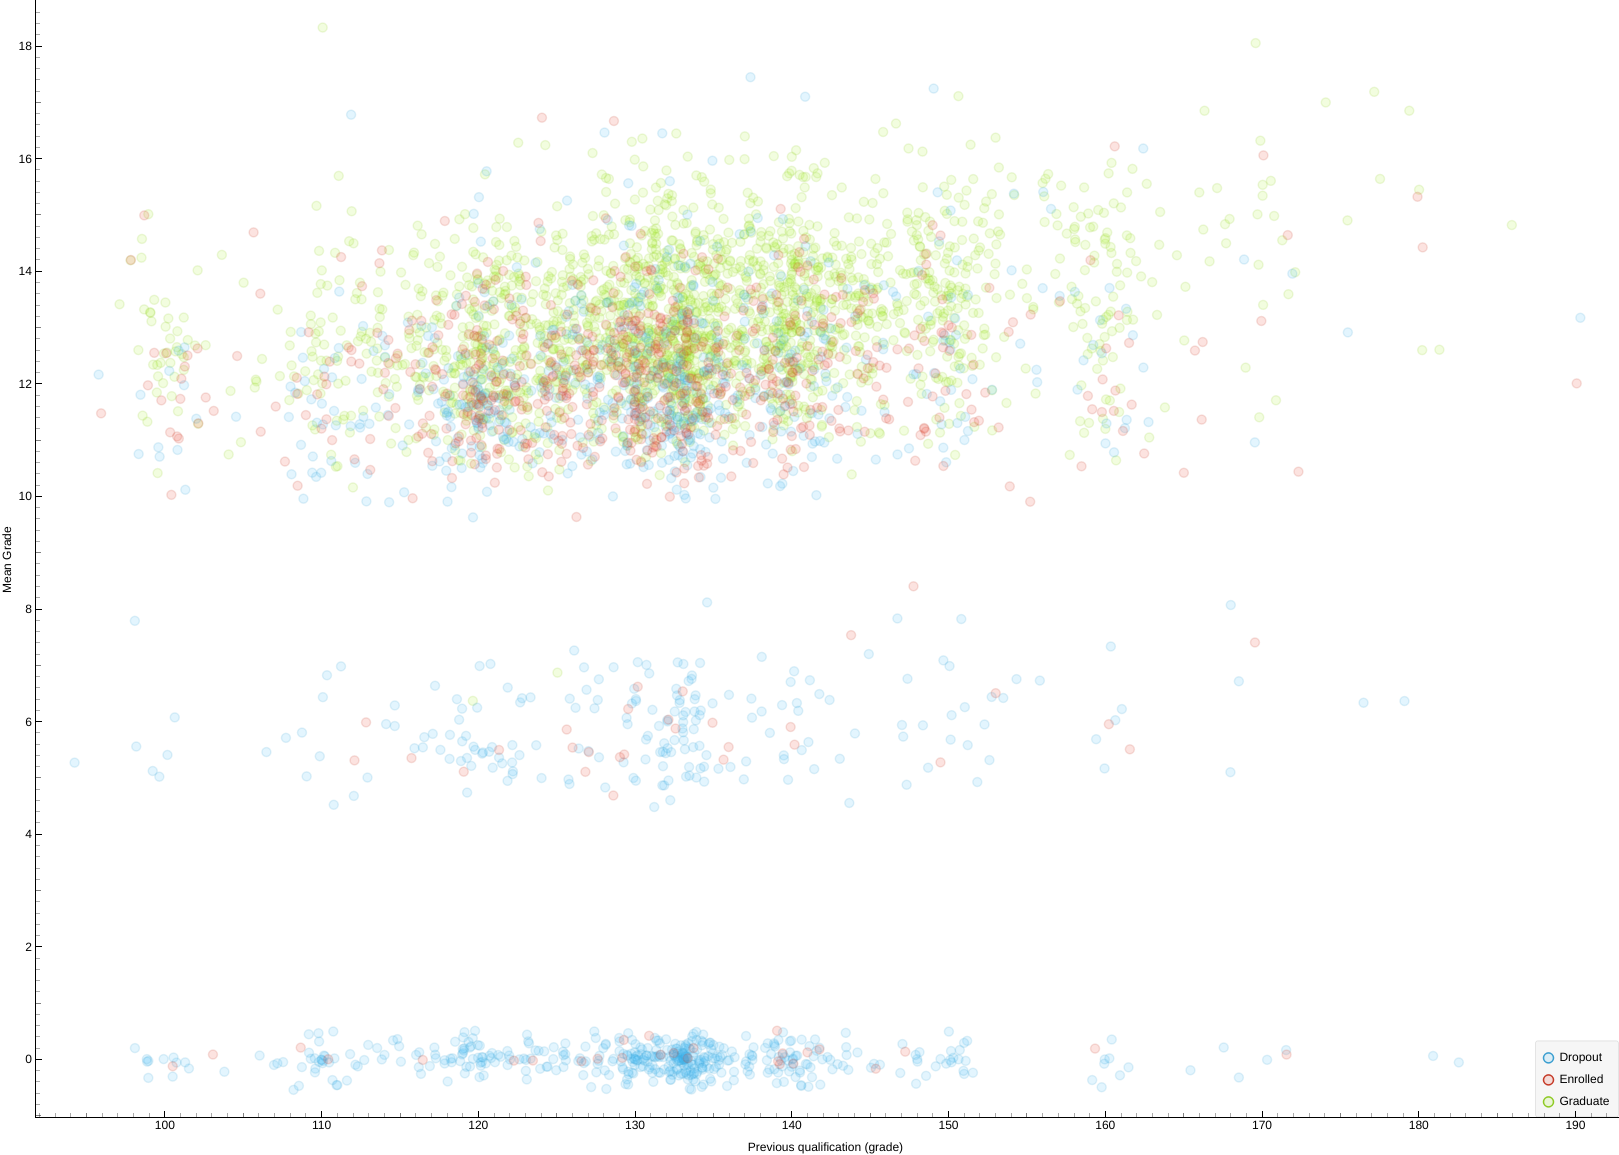
The scatter plot above shows compares the previous qualification grade (x-axis) and mean grade (y-axis). The scatter plot shows three distinct groups of students similar to the mean grade distribution chart. This chart also shows that there is no direct relationship between the previous qualification grade and the mean grade. This shows that the student's previous qualifications are not reliable indicators of a students academic performance (at least for the 1st and 2nd semesters).
##### Comparing Previous Qualifications and Admission Grade
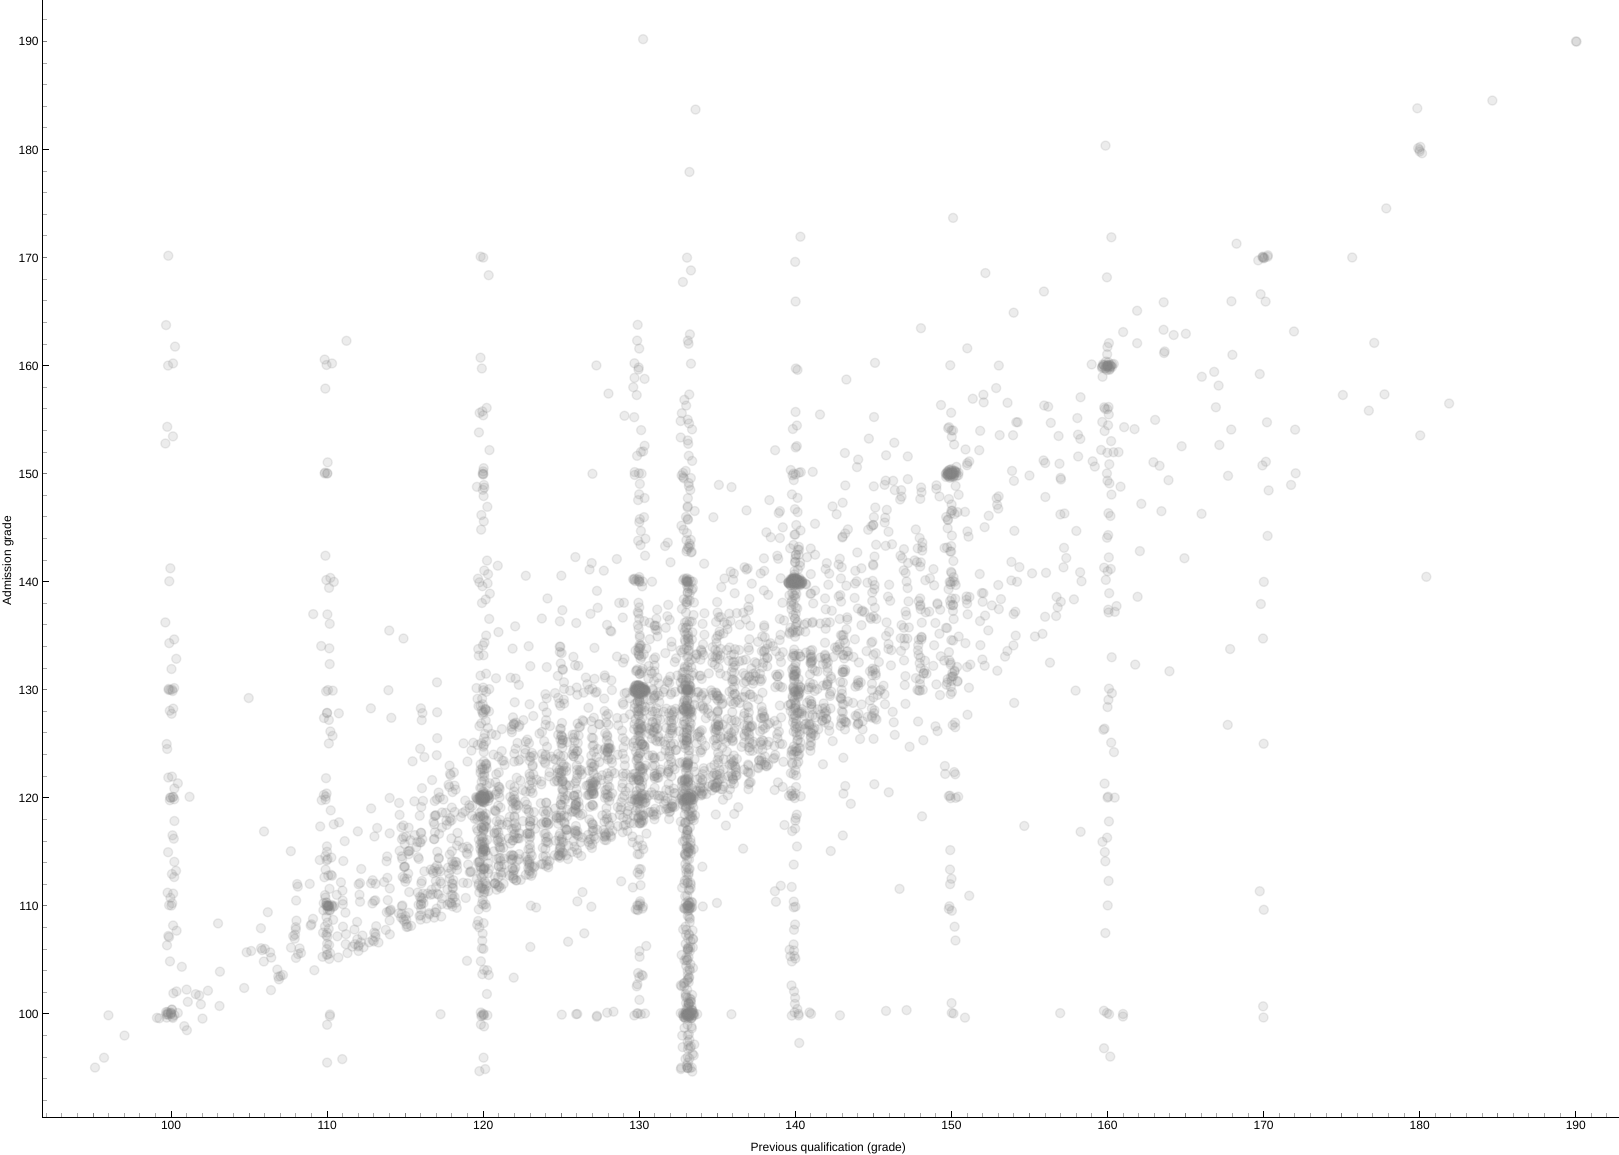
When comparing previous qualification grade (x-axis) and admission grade (y-axis), it shows that there is a direct relationship between the two feature. The higher the previous qualification grade, the higher the admission grade tends to be. This suggests that a students previous qualification grade is used to calculate the admission grade.
## Predictive Insights
Since the dataset is mainly used to create predictive models. A simple Logistic Regression model was also created to make predictive insights. The model was trained on 85% of the dataset, leaving 15% for testing. The model was able to predict with an F-1 score of 76.1%.
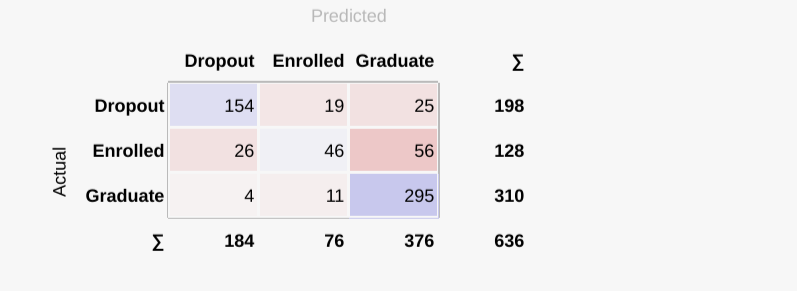
The confusion matrix shows that there are 25 students from the test set that was predicted to graduate but the actual outcome was dropout. It would be interesting to study what is in common with these incorrectly predicted students.
## Citations
*M.V.Martins, D. Tolledo, J. Machado, L. M.T. Baptista, V.Realinho. (2021) "Early prediction of student’s performance in higher education: a case study" Trends and Applications in Information Systems and Technologies, vol.1, in Advances in Intelligent Systems and Computing series. Springer. DOI: 10.1007/978-3-030-72657-7_16*
 Sign in with Wallet
Connect another wallet
Sign in with Wallet
Connect another wallet