# matplotlib
[](https://hackmd.io/@RogelioKG/matplotlib)
## References
+ 🔗 [**入門**](https://matplotlib.org/stable/tutorials/introductory/usage.html)
+ 🔗 [**中文入門**](https://steam.oxxostudio.tw/category/python/example/matplotlib-index.html)
+ 🔗 [**核心指南**](https://medium.com/%E6%95%B8%E6%93%9A%E4%B8%8D%E6%AD%A2-not-only-data/%E6%B7%B1%E5%85%A5%E6%B7%BA%E5%87%BA-python-%E8%A6%96%E8%A6%BA%E5%8C%96%E5%A5%97%E4%BB%B6-matplotlib-seaborn-%E6%A0%B8%E5%BF%83%E6%8C%87%E5%8D%97%E8%88%87%E7%B9%AA%E8%A3%BD-44a47458912)
+ 🔗 [**圖表學習**](https://www.python-graph-gallery.com/)
+ 🔗 [**樣板**](https://matplotlib.org/stable/api/_as_gen/matplotlib.axes.Axes.set_ylabel.html#matplotlib.axes.Axes.set_ylabel4)
+ 🔗 [**動畫**](https://steam.oxxostudio.tw/category/python/example/matplotlib-animation.html)
## Document
+ 🎨 [**圖表風格**](https://matplotlib.org/stable/gallery/style_sheets/style_sheets_reference.html)
+ 🎨 [**顏色**](https://matplotlib.org/stable/tutorials/colors/colors.html)
+ 🎨 [**顏色整理**](https://matplotlib.org/stable/gallery/color/named_colors.html#sphx-glr-gallery-color-named-colors-py)
+ 🎨 [**顏色地圖**](https://matplotlib.org/stable/tutorials/colors/colormaps.html?highlight=colormaps)
+ 🎨 [**線條**](https://matplotlib.org/stable/gallery/lines_bars_and_markers/linestyles.html)
+ 🎨 [**資料點**](https://matplotlib.org/stable/gallery/lines_bars_and_markers/marker_reference.html)
+ 🎨 [**資料點整理**](https://matplotlib.org/stable/api/markers_api.html#module-matplotlib.markers)
+ 🎨 [**標題**](https://matplotlib.org/stable/tutorials/text/text_intro.html)
+ 🎨 [**基礎註記**](https://matplotlib.org/stable/tutorials/text/annotations.html#annotations-tutorial)
+ 🎨 [**進階註記**](https://matplotlib.org/stable/tutorials/text/annotations.html#plotting-guide-annotation)
+ 🎨 [**圖例**](https://matplotlib.org/stable/tutorials/intermediate/legend_guide.html)
+ 🎨 [**刻度定位**](https://matplotlib.org/stable/gallery/ticks/tick-locators.html)
+ 🎨 [**刻度格式**](https://matplotlib.org/stable/gallery/ticks/tick-formatters.html)
## Note
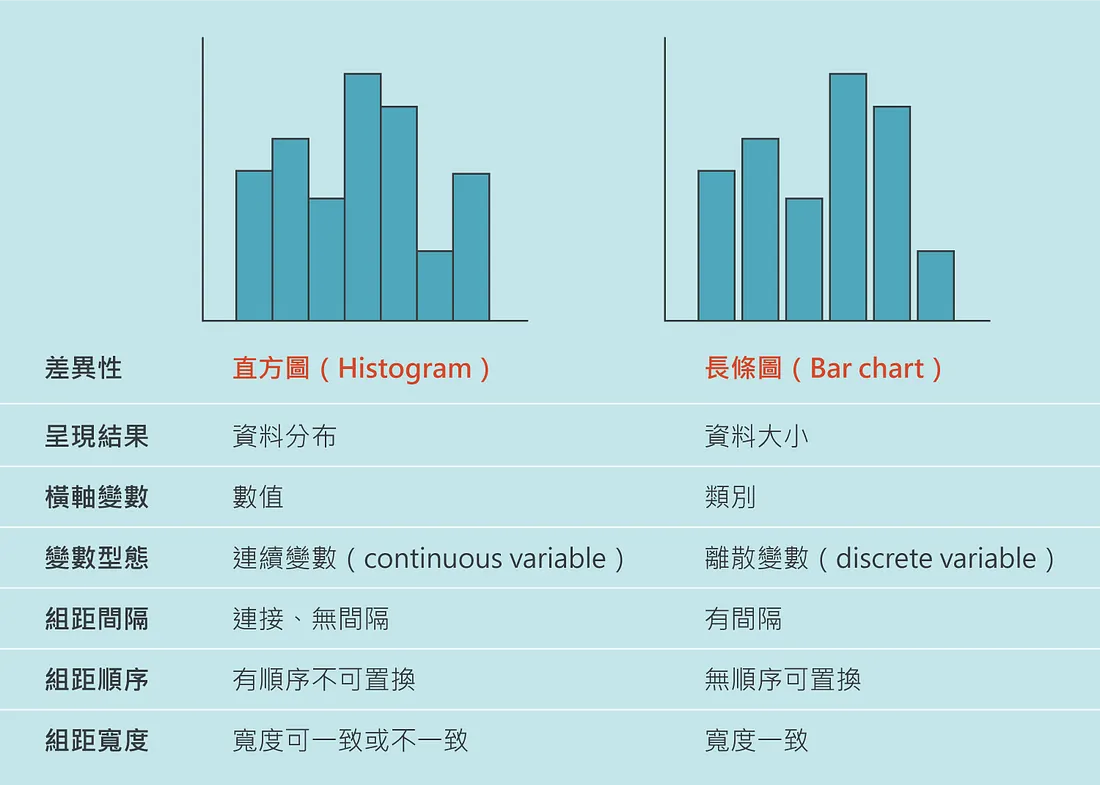
+ 直方圖 (histogram) / 長條圖 (bar chart)
## Initialization
```py
import numpy as np
import matplotlib.pyplot as plt
# 1. figure / add_subplot
# 優點:推薦使用這種方式 ✅
def method_1():
fig1 = plt.figure(figsize=(8, 8))
ax1 = fig1.add_subplot(1, 1, 1)
fig2 = plt.figure(figsize=(4, 4))
ax2 = fig2.add_subplot(1, 1, 1)
x = np.linspace(0, 100, 100)
(line1,) = ax1.plot(x, x)
(line2,) = ax2.plot(x, x*x)
# 2. figure / subplot
# 缺點:如果有多個 fig 就認不出是哪個
def method_2():
fig = plt.figure(figsize=(8, 6))
ax4 = plt.subplot(
2, 3, 4
) # 2x3 子圖中,僅先創建第 4 個子圖,等價於 fig.add_subplot(2, 3, 4)
ax12 = plt.subplot(2, 3, (1, 2)) # 2x3 子圖中,第 1 個子圖與第 2 個子圖融合
ax5 = plt.subplot(2, 3, 5, projection="polar") # 允許單獨一個子圖創建為極座標圖
ax4.scatter([*range(10)], [*range(10)]) # 第 4 個子圖將作為散佈圖
# 3. subplots
# 優點:矩陣索引很方便
# 缺點:hightlight 認不出型別
def method_3():
fig, axs = plt.subplots(2, 3) # 一次創建 2x3 的所有子圖
axs[1][1].scatter([*range(10)], [*range(10)]) # 索引位置 [1][1] 的子圖將作為散佈圖
# 4. plt
# 優點:懶人包,快
# 缺點:細項難調
def method_4():
plt.scatter([*range(10)], [*range(10)]) # 1x1 子圖直接畫
if __name__ == "__main__":
method_1()
plt.show()
```
## 模組 `pyplot`
### **變數**
+ `rcParams`
```py
plt.rcParams
#全域變數 一些全域設定可供調整
```
### **函式**
```py
plt.show()
#函式 show (show 出圖表)
plt.close()
#函式 close (關閉視窗)
plt.clf()
#函式 clf (清除 fig 所有內容)
```
### **建圖**
```py
fig = plt.figure()
#函式 figure 🛑畫布 -> Figure
# num = 畫布的ID(指定同個ID就會畫在同個畫布上)
# figsize = 畫布大小(寬,高) (inch)
# dpi = 每英寸點數
# facecolor = 背景顏色
# edgecolor = 外框顏色
# linewidths = 外框粗細
# frameon = 是否顯示外框和背景色
```
```py
ax = plt.subplot()
#函式 subplot 🛑產生1個子圖 -> AxesSubplot
#參數 列數量m, 行數量n, 索引i (可合併在一起寫成mni)
# -> 意思是指整張畫布有幾個子圖
# 範例:
# (2,3,1) 就表示整張畫布
# 2: 2列
# 3: 3行 (所以最多可以放6個子圖)
# 1: 該子圖佔據【索引1】的位置
# 1 2 3
# 4 5 6
# 範例:
# (2,3,(1,4)) 該子圖橫跨佔據【索引1和索引4】兩個位置
```
```py
fig, ax = plt.subplots()
#函式 subplots 🛑產生m*n個子圖 -> (Figure, AxesSubplot | AxesSubplot 陣列 | AxesSubplot 矩陣 )
#參數 列數量m
#參數 行數量n
#參數 sharex = 和誰共享x軸
#參數 sharey = 和誰共享y軸
#參數 figsize = 畫布大小(寬,高) (單位:inch)
#參數 subplot_kw = 其餘參數字典
# 'projection' :
# 'rectilinear'(🔅直線投影),
# 'polar' (極投影),
# '3d' (3D),
# 'aitoff' (一種等積投影),
# 'hammer' (一種等積投影),
# 'mollweide' (一種等積投影),
# 'lambert' (一種等角圓錐投影)
```
### **fig**
```py
from matplotlib.figure import Figure
fig: Figure
fig.add_subplot()
#方法 add_subplot()
# (推薦使用:figure / add_subplot 建圖法)
fig.savefig()
#方法 savefig()
#參數 檔案名稱.副檔名
#參數 dpi = 每英寸點數 (【dpi=100】大概【570x441】,根據這個比例,dpix2,解析度寬高x2)
```
+ **ax**
```py
ax.cla()
#函式 cla (清除子圖)
```
### **ax (2D)**
```py
ax: plt.Axes
```
+ [`ax.plot()`](https://matplotlib.org/stable/api/_as_gen/matplotlib.pyplot.plot.html)
```py
#方法 plot() 🛑折線圖
#回傳 -> list[line2D]
#參數 x座標陣列
#參數 y座標陣列(🔅若只傳入一組陣列)
#參數 color = 色碼:#xxxxxx / 顏色:r、g、b、m、c、y ... / RGB tuple:(0,0,0)~(1,1,1) / RGBA tuple:(0,0,0,0)~(1,1,1,1) / RGB tuple:(0,0,0)~(1,1,1) / RGBA tuple:(0,0,0,0)~(1,1,1,1)
#參數 marker = 資料點形狀:🔅o、.、,、v ...
#參數 markersize = 🔅6
#參數 linestyle = 線條樣式:🔅solid、-、--、-.、: ...
#參數 linewidth = 線條粗細🔅2
#參數 label = 資料說明標籤,如果有多筆數據資料,使用list
#參數 animated = 表示回傳的 line2D 是要被拿來更新的,這可以大大提高動畫效率
```
+ [`ax.scatter()`](https://matplotlib.org/stable/api/_as_gen/matplotlib.pyplot.scatter.html)
```py
#方法 scatter() 🛑散布圖
#回傳 -> PathCollection
#參數 x座標陣列
#參數 y座標陣列(🔅若只傳入一組陣列)
#參數 c = 色碼:#xxxxxx / 顏色:r、g、b、m、c、y ... / RGB tuple:(0,0,0)~(1,1,1) / RGBA tuple:(0,0,0,0)~(1,1,1,1)
#參數 cmap = 顏色地圖,如果 c 為數據資料,會根據 c 的數據對應指定顏色。(c=數據陣列,cmap='Set1' -> 根據數據陣列映射到Set1的顏色地圖上)
#參數 marker = 資料點形狀:🔅o、.、,、v ...
#參數 s = (資料點大小) marker size
#參數 vmin = 對照顏色地圖的最小值,數值小於vmin時,只會顯示某顏色
#參數 vmax = 對照顏色地圖的最大值,數值大於vmax時,只會顯示某顏色
#參數 alpha = 資料點透明度🔅1,範圍 0 (完全透明) ~ 1 (完全不透明)
#參數 linewidths = 資料點外框粗細🔅無外框
#參數 label = 資料說明標籤,如果有多筆數據資料,使用list
```
+ [`ax.bar()`](https://matplotlib.org/stable/api/_as_gen/matplotlib.pyplot.bar.html) / [`ax.barh()`]()
```py
#方法 bar() 🛑長條圖
#方法 barh() 🛑水平長條圖
#回傳 -> BarContainer
#參數 x位置陣列
#參數 y高度陣列
#參數 width / height(水平) = 寬度🔅0.8
#參數 bottom = 底部位置🔅0(若=前一個y高度陣列,則為🛑堆疊長條圖)
#參數 align = 對齊方式:🔅center、edge
#參數 color = (內部顏色) 色碼:#xxxxxx / 顏色:r、g、b、m、c、y ... / RGB tuple:(0,0,0)~(1,1,1) / RGBA tuple:(0,0,0,0)~(1,1,1,1)
#參數 edgecolor = (邊框顏色) 色碼:#xxxxxx / 顏色:r、g、b、m、c、y ... / RGB tuple:(0,0,0)~(1,1,1) / RGBA tuple:(0,0,0,0)~(1,1,1,1)
#參數 linewidth = 🔅2
#參數 tick_label = x軸文字🔅x位置陣列
#參數 xerr, yerr = x軸、y軸的誤差範圍🔅0
#參數 ecolor = 誤差線段顏色🔅黑色
#參數 capsize = 誤差範圍的上下線條尺寸🔅0
#參數 fill = 是否填滿🔅True
#參數 label = 資料說明標籤,如果有多筆數據資料,使用list
```
+ [`ax.pie()`](https://matplotlib.org/stable/api/_as_gen/matplotlib.pyplot.pie.html)
```py
#方法 pie() 🛑圓餅圖 (pct:percentage)
#回傳 -> tuple[list[Wedge], list[Text], list[Text]]
#參數 比例陣列(例如[1,2,1,3]就是把圓餅均分為7等分,並且以1/2/1/3塊分給不同派)
#參數 radius = 圓餅圖半徑🔅1。
#參數 counterclock = 圓餅圖方向🔅True(逆時針)
#參數 startangle = 起始角度🔅0度(水平向右)
#參數 label = 資料說明標籤,如果有多筆數據資料,使用list
#參數 labeldistance = 標籤與圓餅圖的距離🔅1.1
#參數 explode = 派往外延伸的距離🔅0
#參數 shadow = 陰影🔅Fasle(無陰影)
#參數 autopct = 內部文字(自動計算百分比)🔅無,可使用函式產生和組合 ('%.1f%%' -> 顯示小數點一位的浮點數,後方加上百分比符號)
#參數 textprops = 文字樣式字典 {'color':?,'weight':?,'size':?}
#參數 wedgeprops = 扇形樣式字典 {'linewidth':?,'edgecolor':?,'width':?} (若width<radius則為🛑甜甜圈圖)
#參數 pctdistance = 內部文字與中心點距離🔅0.6
```
+ [`ax.contour()`](https://matplotlib.org/stable/api/_as_gen/matplotlib.pyplot.contour.html) / [`ax.contourf()`]()
```py
#方法 contour() 🛑等高線圖
#方法 contourf() 🛑等高線面積圖
#參數 x座標陣列
#參數 y座標陣列
#參數 z高度陣列
#參數 levels = int:等高線的數量 /
# 陣列:以該陣列為等高線,不過會自動去掉 local max 和 local min (如果有的話)
#參數 colors / cmap = 等高線顏色,若不足 levels 的數量,則會自動重複
#參數 vmin, vmax = 等高線顏色的最小值與最大值
#參數 linewidths = 等高線的粗細
#更多參數
# ✅參數指定懶人包:
# x = np.linspace(?,?,step1)
# y = np.linspace(?,?,step2)
# z = [[func(x[i],y[j]) for i in range(step1)] for j in range(step2)]
# lv = np.linspace(np.min(z), np.max(z), 精細度)
```
+ [`ax.step()`](https://matplotlib.org/stable/api/_as_gen/matplotlib.pyplot.step.html)
```py
#方法 step() 🛑階梯折線圖
#參數 x位置陣列
#參數 y高度陣列
#參數 where = 垂直線段對齊位置 (🔅pre(左)、mid(中)、post(右))
#參數 color = 色碼:#xxxxxx / 顏色:r、g、b、m、c、y ... / RGB tuple:(0,0,0)~(1,1,1) / RGBA tuple:(0,0,0,0)~(1,1,1,1)
#參數 linestyle = 線條樣式:🔅solid、-、--、-.、: ...
#參數 linewidth 線條粗細🔅2
#參數 label = 資料說明標籤,如果有多筆數據資料,使用list
```
+ [`ax.stackplot()`](https://matplotlib.org/stable/api/_as_gen/matplotlib.axes.Axes.stackplot.html)
```py
#方法 stackplot() 🛑堆疊折線圖
#參數 x位置陣列
#參數 y高度陣列 (如果有多數據,使用逗號分隔,例如:y1,y2,y3...)
#參數 baseline = 基線模式(🔅zero(自x=0層層堆疊)、sym(對稱於x=0堆疊,Σyi[k]/2得到半和,並將其偏移到0)、wiggle、weighted_wiggle)
#參數 label = 資料說明標籤,如果有多筆數據資料,使用list
#參數 color = 色碼:#xxxxxx / 顏色:r、g、b、m、c、y ... / RGB tuple:(0,0,0)~(1,1,1) / RGBA tuple:(0,0,0,0)~(1,1,1,1)
```
+ [`ax.imshow()`](https://matplotlib.org/stable/api/_as_gen/matplotlib.pyplot.imshow.html)
```py
#方法 imshow() 🛑熱圖
#參數 矩陣
#參數 cmap = 顏色地圖
#參數 norm = 是否標準化
#參數 vmin, vmax = 可著色的最小值與最大值(無標準化時啟用)
#參數 interpolation = 插值 (影像放大算法) (🔅nearest)
#參數 aspect = 長寬比 (🔅equal(正方格子)、auto(以滿足畫布比例為前提自動調整))
#參數 alpha = 透明度
```
+ [`ax.hist()`](https://matplotlib.org/stable/api/_as_gen/matplotlib.pyplot.hist.html)
```py
#方法 hist() 🛑直方圖
#⚠ 我不是長條圖,我是統計數量的
#⚠ 看預設直方圖時,按照x軸間距都是以[,)[,)...[,]來做統計數量
#⚠ 這樣設定:bins=x.max()-x.min(), range=(x.min(),x.max()),柱子的數量就會是底下左邊的整數(如果是整數統計的話)
#參數 x資料陣列
#參數 range = x軸的範圍tuple🔅(x.min(), x.max())
#參數 bins = int:根據range分成n根柱子
# list:兩兩範圍內統計(假設給定[1,2,4,8,10]->分別統計[1,2)、[2,4)、[4,8)、[8,10]內的數量,這表示柱子可以不等寬)
# str:'auto'、'fd'、'doane'、'scott'、'stone'、'rice'、'sturges'、'sqrt'
#參數 density = 是否將y軸上的統計數量切換成機率密度🔅False
#參數 weights = 權重(須給定和x資料陣列一樣長度的陣列,這裡權重的概念可以理解為1個當n個數的概念)
#參數 cumulative = 累積🔅False
#參數 bottom = 以y(數量)=n為底部🔅0
#參數 histtype = x資料為2D陣列時:'bar'(每列資料的柱子並排)、'barstacked'(每列資料的柱子堆疊)、'step'(每列資料的透明柱子重疊)、'stepfilled'(每列資料的填滿柱子重疊)
#參數 align = 對齊:'left'、🔅'mid'、'right'
#參數 orientation = 垂直或水平🔅'vertical'、'horizontal'
#參數 rwidth = 相對寬度
#參數 log = 對數尺度🔅False
#參數 color = 為每列資料的柱子指定顏色(色碼:#xxxxxx / 顏色:r、g、b、m、c、y ... / RGB tuple:(0,0,0)~(1,1,1) / RGBA tuple:(0,0,0,0)~(1,1,1,1) )
#參數 label = 資料說明標籤,如果有多筆數據資料,使用list
#參數 stacked = 強制堆疊🔅False
#參數 lw = 寬度
#參數 ec = 邊框顏色
#參數 fc = 柱子顏色
```
+ [`ax.boxplot()`](https://matplotlib.org/stable/api/_as_gen/matplotlib.pyplot.boxplot.html)
```py
#方法 boxplot() 🛑盒狀圖
# 四分位距:IQR = Q3-Q1
# 中位數:Q2
# 鬚狀線:whisker
# 離群值:outlier(與Q1或Q3差距超過1.5×IQR的數值)
# 適度離群值:位於範圍外1.5×IQR~3×IQR範圍的數值
# 極端離群值:位於範圍外3×IQR以上的數值
# 一般的盒狀圖:
# min Q1 median Q3 max
# |-----:-----|
# |--------------| : |----------------|
# |-----:-----|
# <----------->
# IQR
# <-------------><----><-----><--------------->
# 25% 25% 25% 25%
# 如果您沒有啟用離群值,則鬚狀線會延伸至標繪圖中的最大值和最小值。
# 如果您啟用離群值,則鬚狀線表示超出內四分位距但距離夠近而不會被視為離群值的值範圍。
# 如果有大量的離群值,則以長條表示離群值的範圍。
# 開啟離群值的盒狀圖:
# >Q1-1.5IQR Q1 median Q3 <Q3+1.5IQR
# |-----:-----|
# o |--------| : |--------| o o
# |-----:-----|
# outlier <-----------> outliers
# IQR
#參數 數據陣列(按列作盒狀圖)
#參數 notch = 是否輸出為凹槽盒狀圖🔅False(https://blog.csdn.net/williamlon/article/details/105284119)
#參數 sym = 離群點的形狀:🔅o、.、,、v ...
#參數 vert = 是否垂直🔅True
#參數 whis = n:超過n×IQR的數值為離群值🔅1.5 / (m,M):非介於第m~M百分位的數據皆被歸為離群點 -> 最小(25,75) 最大(0,100)
#參數 widths = 盒子寬度🔅0.5
#參數 label = 資料說明標籤,如果有多筆數據資料,使用list
#參數 showmeans = 平均數位置🔅True
```
### **ax (3D)**
+ `ax.voxels`
```py
```
## 模組 `style`
### **變數**
+ `available`
```py
print(style.available)
# 所有可用風格
# ['Solarize_Light2', '_classic_test_patch', '_mpl-gallery', '_mpl-gallery-nogrid', 'bmh',
# 'classic', 'dark_background', 'fast', 'fivethirtyeight', 'ggplot', 'grayscale', 'seaborn-v0_8',
# 'seaborn-v0_8-bright', 'seaborn-v0_8-colorblind', 'seaborn-v0_8-dark', 'seaborn-v0_8-dark-palette',
# 'seaborn-v0_8-darkgrid', 'seaborn-v0_8-deep', 'seaborn-v0_8-muted', 'seaborn-v0_8-notebook',
# 'seaborn-v0_8-paper', 'seaborn-v0_8-pastel', 'seaborn-v0_8-poster', 'seaborn-v0_8-talk',
# 'seaborn-v0_8-ticks', 'seaborn-v0_8-white', 👍'seaborn-v0_8-whitegrid', 'tableau-colorblind10']
```
### **函式**
+ `use`
```py
# 使用風格
style.use('seaborn-v0_8-whitegrid')
```
## 模組 `animation`
### **類別** `FuncAnimation`
|🚨 <span class="caution">CAUTION</span>|
|:---|
|`ani.save` 是按照你給定的 `frames` 去決定要生成多少幀,即便有設定 `repeat` 也沒用|
```py
from collections.abc import Iterable
import matplotlib.pyplot as plt
import numpy as np
from matplotlib.animation import FuncAnimation
# 創建一個畫布和一個子圖
fig: plt.Figure = plt.figure(figsize=(8, 8))
ax: plt.Axes = fig.add_subplot(1, 1, 1)
xdata: list[np.float64] = []
ydata: list[np.float64] = []
artists = ax.plot(xdata, ydata, animated=True) # 只有一個 Artist (line,)
# 初始設置
def init() -> Iterable[plt.Line2D]: # 回傳 Iterable[Artist]
ax.set_xlim(0, 2 * np.pi)
ax.set_ylim(-1.5, 1.5)
return artists
# 更新函數
def update(frame: np.float64) -> Iterable[plt.Line2D]: # 回傳 Iterable[Artist]
xdata.append(frame)
ydata.append(np.sin(frame))
artists[0].set_data(xdata, ydata) # 給 Artist 設定新資料
return artists
# 創建動畫
ani: FuncAnimation = FuncAnimation(
fig,
func=update,
frames=np.linspace(0, 2 * np.pi, 128),
init_func=init,
interval=50,
blit=True,
repeat=False,
)
plt.show()
# 此範例僅更新一個 Artist
# 若你想更新多個 Artists (比如說涉及多個圖表),也是同樣的道理
# 只要在 update 函數給多個 Artist 設定新資料後,一併回傳出來即可
```
```py
# FuncAnimation
# (
# #參數 fig
# + 畫布
#
# #參數 func
# + 每個幀都會調用的函數
# + def func(frame, *fargs) -> Iterable[Artist]
# + frame: 第一參數固定,是被傳入的一幀的數據
# + *fargs: 其他隨意
# + 可使用 partial 柯里化,預先固定其他參數
# + FuncAnimation(fig, partial(func, a='foo', b='bar'))
#
# #參數 frames
# + 傳入 list[frame]
# + 所有幀的數據 (而 frame 是一幀的數據)
# + 傳入 int
# + 相當於 range(frames)
#
# #參數 init_func
# + 在第一幀開始前調用的函數
# + def init_func(frame, *fargs) -> Iterable[Artist]
#
# #參數 save_count
# + 如果 frames 傳入沒有長度的迭代器或生成器,那這就是它能產生多少幀的限制
#
# #kw參數 interval
# + 幀間延遲時間
#
# #kw參數 repeat
# + 所有幀完成時,是否要重播
#
# #kw參數 repeat_interval
# + 重播間延遲時間
#
# #kw參數 blit
# + 簡介:
# + 一種優化繪製的技術。
# + 當你需要在動畫中更新部分畫面時,通常會重新繪製整個畫布,這樣會耗費很多資源,特別是在需要高頻率更新的動畫中。
# + 此技術的目的是僅重新繪製需要更改的部分,而不是整個畫布,從而提高了繪製效率。
# + ⚠️ 註:盡可能要設定為 True (除非使用到 Figure Artists)。
# + ⚠️ 註:func / init_func 須回傳被修改的 Iterable[Artist] 才有辦法使用 blit。
# #kw參數 cache_frame_data
# - 是否快取幀數據。當每一幀都包含很大的物件時,禁用快取可能是有用的。
# ):
```
### **存成** `gif`
```py
ani.save("C:\\Users\\user\\Desktop\\animation.gif", writer="pillow", fps=30)
```
### **存成** `mp4`
```py
# ⚠️ 需 ffmpeg
plt.rcParams["animation.ffmpeg_path"] = "C:\\Users\\user\\Desktop\\ffmpeg\\bin\\ffmpeg.exe"
FFwriter = animation.FFMpegWriter(fps=10)
ani.save("C:\\Users\\user\\Desktop\\simulation.mp4", writer=FFwriter)
```
### **視窗**
```py
plt.show()
```
## **類別** `Artist`
> 數據型的藝術家使用 `set_data` 更新
### **簡介**
> 在 Matplotlib 中,\
> 藝術家 (Artist) 是指一個由圖形元素 (例如線條、點、文本等) 構成的物件。\
> 你可以將不同的藝術家添加到圖形中,這些藝術家共同構成了圖形的各個元素。\
> 在動畫中,FuncAnimation 函數期望的返回值就是一個 `Iterable[Artist]`\
> 即包含了在每一幀中需要被更新的所有圖形元素的可迭代物件。\
> 這些被更新的圖形元素將在每一幀的動畫中被重新繪製,以實現動畫的效果。
### **藝術家**
```py
from matplotlib.lines import Line2D
from matplotlib.patches import Rectangle
from matplotlib.patches import Wedge
from matplotlib.text import Text
from matplotlib.collections import PathCollection
from matplotlib.collections import PolyCollection
from matplotlib.image import AxesImage
from mpl_toolkits.mplot3d.art3d import Line3D
from mpl_toolkits.mplot3d.art3d import Poly3DCollection
```
### **容器**
```py
from matplotlib.container import BarContainer
from matplotlib.contour import QuadContourSet
```
### **2D**
```py
# plot
lines = ax.plot()
lines: list[Line2D] # 多個藝術家 (一般而言只產生一個藝術家,這裡只是用 list 包住)
# scatter
pointset = ax.scatter()
pointset: PathCollection # 藝術家
# bar
bars = ax.bar()
bars = ax.barh()
bars: BarContainer[Rectangle] # 多個藝術家
bar: Rectangle # 藝術家
# pie
wedges, texts, autotexts = ax.pie()
wedges: list[Wedge] # 多個藝術家
texts: list[Text] # 多個藝術家
autotexts: list[Text] # 多個藝術家
# contour
contour = ax.contour()
contour = ax.contourf()
contour: QuadContourSet # ...
# step
lines = ax.step()
lines: list[Line2D] # 多個藝術家
# stackplot
stacks = ax.stackplot()
stacks: list[PolyCollection] # 多個藝術家
# imshow
image = ax.imshow()
image: AxesImage
# hist
heights, bins, patches = ax.hist()
heights, bins = np.histogram() # 把 data 丟進去,幫你算好 heights 和 bins
heights: list[float] # 紀錄每個 bar 的高度
bins: list[float] # 切分點 (bar 會生長於切分點之間,這可在一開始 ax.hist 給定)
patches: BarContainer[Rectangle] # 多個藝術家 (bars)
patch: Rectangle # 藝術家 (bar)
# boxplot
box = ax.boxplot()
box: dict[str, list[Line2D]]
```
### **3D**
```py
# 3D 折線圖
# plot
lines = ax.plot()
lines: list[Line3D]
# x, y 數據放 set_data
line.set_data()
# z 數據放 set_3d_properties
line.set_3d_properties()
# 3D 曲面圖
# plot_surface
surface = ax.plot_surface()
surface: Poly3DCollection
# 3D 體素圖
# voxels
# ⚠️ 只有最表層的 voxel 會體現顏色
vox = ax.voxels(voxel_array, facecolors=colors, edgecolor="k")
vox: Poly3DCollection
vox[(4, 2, 4)].set_facecolor((1.0, 1.0, 0.0, 1.0)) # 設成黃色且不透明
```
## **類別** `ColorMap`
### **一般**
```py
from matplotlib import pyplot as plt
cmap = plt.get_cmap("viridis")
color = cmap(0.3) # 數值 0~1 -> 顏色 RGBA
print(color)
```
### **常用**
+ Sequential (連續)
```
viridis ⭐
plasma
inferno
magma
```
+ Diverging (連續、正負關係)
```
coolwarm ⭐
RdBu
bwr
seismic
```
+ Qualitative (離散)
```
tab10 ⭐
tab20
```
### **normalize**
```py
from matplotlib import colors
from matplotlib import pyplot as plt
cmap = plt.get_cmap("viridis")
color_1 = cmap(0.3) # 數值 0~1 -> 顏色 RGBA
norm = colors.Normalize(vmin=0, vmax=100)
color_2 = cmap(norm(30)) # 數值 0~100 -> 顏色 RGBA
assert color_1 == color_2
x = [1, 2, 3, 4, 5]
y = [10, 20, 25, 30, 40]
c = [10, 30, 50, 70, 90] # 數值 0~100
plt.scatter(x, y, c=c, cmap="viridis", norm=norm)
```
```py
from matplotlib import colors
norm = colors.Normalize(vmin=0, vmax=100)
plt.scatter(x, y, c=c, cmap="viridis", norm=norm)
```
 Sign in with Wallet
Connect another wallet
Sign in with Wallet
Connect another wallet