# Debugging Javascript
---
## Where do bugs come from ? :bug:
----
### Grace Hopper ###

----
Where? then Why?
<iframe src="https://giphy.com/embed/3oKIP9tk4g8syW2TV6" width="480" height="270" frameBorder="0" class="giphy-embed" allowFullScreen></iframe>
----
- Figure out what your code should be doing at each step
- Find the step that's going wrong (where ?)
---
## What console methods are there other than console.log? Can these help us debug?
----
## What is the console ?
----
The `console` object gives you access to the browser’s console. It lets you output strings, arrays, and objects that help debug your code.
The `console` is part of the `window` object, and is supplied by the Browser Object Model (BOM). Outputs may appear different in different browsers.
----
We can get access to the `console` in one of two ways:
1. `window.console.log('This works')`
2. `console.log('So does this')`
----
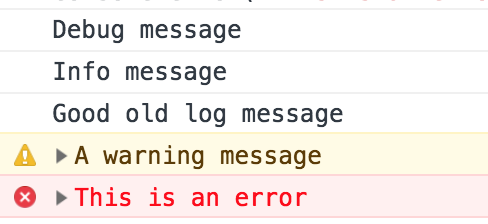
There are four different ways of outputting a message to the console:
1. `log`
2. `info`
3. `warn`
4. `error`
----
```console.debug('Debug message');
console.debug('Debug message');
console.info('Info message');
console.log('Good old log message');
console.warn('A warning message');
console.error('This is an error');
```
----
----

----
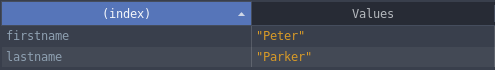
### Table()
The `table` method displays an array or object as a table.
The array’s indices or object property names come under the left-hand index column. Then the values are displayed in the right-hand column.
----
```
const superhero =
{firstname: 'Peter', lastname: 'Parker'}
console.table(superhero);
```
----
----
**Note for Chrome users:** The `table` method doesn’t seem to work in Chrome. You can work around this issue by placing any items into an array of arrays or an array of objects:
----
```
const superhero =
{firstname: 'Peter', lastname: 'Parker',}
console.table([superhero]);
```
----
https://developer.mozilla.org/en-US/docs/Web/API/Console
----
## What Does the debugger Statement do??

----
A breakpoint in the code allows you to examine variables while the code is executing.

---
* The debugger statement stops the execution of JavaScript, and calls (if available) the debugging function.
* Using the debugger statement has the same function as setting a breakpoint in the code.
----
* debugger; is written in your code and works in all browsers
* breakpoint is selected in the console
(They both do the same thing)
----
* If there is no debugging to do, the statement will have no effect.

----
* **BUT** remember to remove it from your code when you are finished (users may complain that the whole webpage pauses when clicking something)
---
## How do we use the `debugger` in our browser?
----
# DEMO
----
### Summary of Debugging Steps
1. Open Chrome DevTools (sources panel)
* Mac: Command (Alt) + Option + I
* Windows/Linux: Control + Shift + I
2. Select a breakpoint
* pre-determined breakpoint e.g. event listeners
* set custom breakpoint (click on line number)
----
3. Step through code
* step over
* step into
* step out
4. Check variable values
* Scope pane
* Watch expressions
* Console
----
5. Apply a fix
6. Celebrate

---
# THE END
{"metaMigratedAt":"2023-06-15T10:53:29.016Z","metaMigratedFrom":"Content","title":"Debugging Javascript","breaks":true,"contributors":"[{\"id\":\"62549a0e-e475-426e-8d74-873019794dd5\",\"add\":990,\"del\":445},{\"id\":\"5a08f6b7-226e-41c7-9fe6-b7ed876fa89a\",\"add\":619,\"del\":62},{\"id\":\"3874f755-d1ce-4002-a0a8-a598e5a58dd7\",\"add\":1405,\"del\":403},{\"id\":\"d3c4a004-0006-4da0-9ba0-d08adcc37a9d\",\"add\":2208,\"del\":305}]"}