## NodeJS CPU heavy tick and memory leak debugging
https://hackmd.io/p/js-paris-nodejs
---
<style>
.reveal code,
.reveal pre code {
background-color: #333;
}
</style>
<img src="https://i.imgur.com/PTbB46S.jpg" style="width:300px;height:300px;border-radius:50%"/>
## Max Wu
#### CTO of HackMD
I love great product and build them.<br>I'm developing my dream with code.
---
# Node.js
Node.js is a JavaScript runtime built on Chrome’s V8 JavaScript engine.
----
# Node.js
- non-blocking event loop
- single threaded
- use Garbage Collector to free up memory
----

[ref.](https://www.c-sharpcorner.com/article/node-js-event-loop/)
---
It's super easy to write a Node.js application.
But it's hard to hunt the Ghost in the shell.
:ghost:
---
## Once upon a time...
:clock10:
----

----
## The CPU usage goes too high
:rocket: :rotating_light:
----
## It stops responsing to the requests
and recover after few minutes
:cry:
----
### It might be restarted by scheduler due to the unresponsiveness
(health check failed)
:boom:
----
### We need to find out who's the killer
:gun:
----
## Node.js profiling
built-in tool to profile the app
`node --prof app.js`
----
### Use ApacheBench to make some load
`ab -k -c 20 -n 250 "http://localhost:3000"`
20 concurrent connections with 250 requests per each
----
## Get the output of ApacheBench
```
Concurrency Level: 20
Time taken for tests: 46.932 seconds
Complete requests: 250
Failed requests: 0
Keep-Alive requests: 250
Total transferred: 50250 bytes
HTML transferred: 500 bytes
Requests per second: 5.33 [#/sec] (mean)
Time per request: 3754.556 [ms] (mean)
Time per request: 187.728 [ms] (mean, across all concurrent requests)
Transfer rate: 1.05 [Kbytes/sec] received
...
Percentage of the requests served within a certain time (ms)
50% 3755
66% 3804
75% 3818
80% 3825
90% 3845
95% 3858
98% 3874
99% 3875
100% 4225 (longest request)
```
----
### Profiling tool will generate a log file
named like:
`isolate-0xnnnnnnnnnnnn-v8.log`
wait for a while to collect more data
----
## Analyze the log file
process the log file the get the statistics by this command
`node --prof-process isolate-0xnnnnnnnnnnnn-v8.log > processed.txt`
----
## View the result
The file is broken up into sections which are again broken up by language
```
[Bottom up (heavy) profile]:
Note: percentage shows a share of a particular caller in the total
amount of its parent calls.
Callers occupying less than 1.0% are not shown.
ticks parent name
98984 37.6% UNKNOWN
83688 31.8% /lib/x86_64-linux-gnu/libc-2.19.so
2162 2.6% /usr/local/bin/node
583 27.0% Builtin: StringPrototypeReplace
148 25.4% LazyCompile: *InlineLexer.output /hackmd/node_modules/marked/lib/marked.js:585:40
66 44.6% LazyCompile: *Parser.tok /hackmd/node_modules/marked/lib/marked.js:1043:32
22 33.3% LazyCompile: ~Parser.parse /hackmd/node_modules/marked/lib/marked.js:992:34
21 31.8% LazyCompile: *Parser.parse /hackmd/node_modules/marked/lib/marked.js:992:34
19 28.8% LazyCompile: *Parser.tok /hackmd/node_modules/marked/lib/marked.js:1043:32
4 6.1% RegExp: \\bXbox *\\d+[.\\w_]* {3}
37 25.0% LazyCompile: *InlineLexer.output /hackmd/node_modules/marked/lib/marked.js:585:40
19 51.4% LazyCompile: *Parser.tok /hackmd/node_modules/marked/lib/marked.js:1043:32
9 24.3% LazyCompile: ~Parser.tok /hackmd/node_modules/marked/lib/marked.js:1043:32
6 16.2% LazyCompile: *InlineLexer.output /hackmd/node_modules/marked/lib/marked.js:585:40
1 2.7% RegExp: \\bChrome\\b
...
```
----
## Here you are!
We found the `marked` library that used for parsing markdown cause the problem.
----
## FlameGraph
might be another helpful option

[ref.](https://medium.com/springworks-engineering/node-js-profiling-event-loop-lag-flame-charts-539e04723e84)
---
# Yet another story :book:
----
## Once upon a time...
:clock10:
----
## The Memory usage goes too high
:rocket: :rotating_light:
----

----
## It fills the instance memory every few hours
and been killed by the OS scheduler
----
## Symptom :pill:
- the response time becomes higher and higher, until the memory usage reaches 100% or above
- and the application stops responding
- there is not enough swap left, the server can even fail to accept SSH connections
----
## This problem is the well-known "Memory leaks"

----
### We need to find out who's the killer
again
:tired_face:
----
## What tools we have
- inspector
- memwatch-next & heapdump
----
## Enable the inspector
use the built-in inspector to understand your app
`node --inspect app.js`
----
### Use ApacheBench to make some load
`ab -k -c 20 -n 250 "http://localhost:3000"`
20 concurrent connections with 250 requests per each
----

----
### There is no graphic server on the production
Let's make the server generates the memory dump
----
## memwatch-next
triggers events when the memory usage still growing after 5 consecutive GCs
----
```javascript=
const Memwatch = require('memwatch-next');
/**
* Check for memory leaks
*/
let hd = null;
Memwatch.on('leak', (info) => {
console.log('memwatch::leak');
console.error(info);
if (!hd) {
hd = new Memwatch.HeapDiff();
}
else {
const diff = hd.end();
console.error(Util.inspect(diff, true, null));
trace.report('memwatch::leak', {
HeapDiff: hd
});
hd = null;
}
});
Memwatch.on('stats', (stats) => {
console.log('memwatch::stats');
console.error(Util.inspect(stats, true, null));
trace.report('memwatch::stats', {
Stats: stats
});
});
```
----
## View the heapdiff
```
memwatch::stats // <-- GC stats
{ num_full_gc: 227,
num_inc_gc: 991,
heap_compactions: 227,
usage_trend: 1.3, // <-- the usage trending
estimated_base: 49219293,
current_base: 47057208,
min: 41628720,
max: 50299360 }
memwatch::leak // <-- the leak event
growth=1362440, reason=heap growth over 5 consecutive GCs (1m 56s) - 40.32 mb/hr
// show the heap diff
{ before: { nodes: 401400, size_bytes: 44743648, size: '42.67 mb' },
after: { nodes: 407650, size_bytes: 46306635, size: '44.16 mb' },
change:
{ size_bytes: 1562987,
size: '1.49 mb',
freed_nodes: 24397,
allocated_nodes: 30647,
details:
[ { what: 'Array',
size_bytes: 557728,
size: '544.66 kb',
'+': 5438,
'-': 2962 },
{ what: 'ArrayBuffer',
size_bytes: 560,
size: '560 bytes',
'+': 21,
'-': 14 },
{ what: 'Buffer',
size_bytes: 400,
size: '400 bytes',
'+': 12,
'-': 7 },
{ what: 'BufferList',
size_bytes: 1200,
size: '1.17 kb',
'+': 48,
'-': 23 },
{ what: 'Client', size_bytes: 0, size: '0 bytes', '+': 5, '-': 5 },
{ what: 'Closure',
size_bytes: 28080,
size: '27.42 kb',
'+': 1525,
'-': 1021 },
{ what: 'Code',
size_bytes: 405144,
size: '395.65 kb',
'+': 315,
'-': 61 },
...
```
----
It's better if we can have the whole heap to inspect
----
## heapdump
dumping the memory stack of node.js app to a file to inspect later
----
```javascript=
const http = require('http');
const heapdump = require('heapdump');
const requestLogs = [];
const server = http.createServer((req, res) => {
if (req.url === '/heapdump') {
heapdump.writeSnapshot((err, filename) => {
console.log('Heap dump written to', filename)
});
}
requestLogs.push({ url: req.url, date: new Date() });
res.end(JSON.stringify(requestLogs));
});
server.listen(3000);
console.log('Server listening to port 3000. Press Ctrl+C to stop it.');
console.log(`Heapdump enabled. Run "kill -USR2 ${process.pid}" or send a request to "/heapdump" to generate a heapdump.`);
```
----
## Trigger dumping by USR2 signal
```bash=
$ node index.js
Server listening to port 3000. Press Ctrl+C to stop it.
Heapdump enabled. Run "kill -USR2 29431" or send a request to "/heapdump" to generate a heapdump.
$ kill -USR2 29431
$ curl http://localhost:3000/heapdump
$ ls
heapdump-31208326.300922.heapsnapshot
heapdump-31216569.978846.heapsnapshot
```
----
## Load dump to Chrome Dev Tools
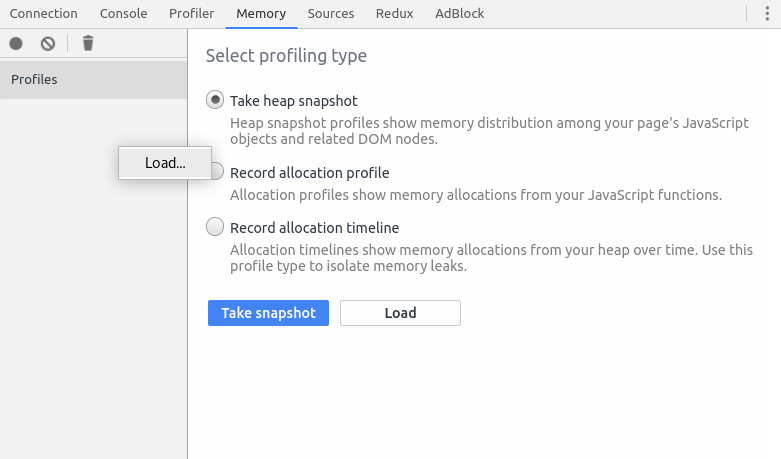
----
## Look into the dev tools

----
## Here you are!
We found the `gray-matter` library that used for generating the page title cause the problem.
[ref.](https://medium.com/front-end-hacking/my-node-js-memory-leak-and-some-memory-management-and-garbage-collection-6281a5308b4e)
---
### Everything now goes back to normal

---
## Last but not least
the best debbuger of Node.js!
----
## ndb
ndb is an improved debugging experience for Node.js, enabled by Chrome DevTools
----
# Install
`npm install -g ndb`
----
# Opening ndb
`ndb app.js`
----

----
Placing Breakpoints

[ref.](https://nitayneeman.com/posts/debugging-nodejs-application-in-chrome-devtools-using-ndb/)
---
## TL;DR
- look into the CPU: `profiling`
- look into the Memory: `inspecting`
- let the memory talks: `memory dumping`
- the step-by-step debugger: `ndb`
---
# Thanks for listening!
do you have any questions?
---
## References
- [All you need to know to really understand the Node.js Event Loop and its Metrics](https://www.dynatrace.com/news/blog/all-you-need-to-know-to-really-understand-the-node-js-event-loop-and-its-metrics/)
- [Why is node called a non-blocking I/O model?](https://blog.cloudboost.io/why-is-node-called-a-non-blocking-i-o-model-eb639063bc14)
- [What you should know to really understand the Node.js Event Loop](https://medium.com/the-node-js-collection/what-you-should-know-to-really-understand-the-node-js-event-loop-and-its-metrics-c4907b19da4c)
- [Walking Inside the Node.js Event Loop](https://medium.freecodecamp.org/walking-inside-nodejs-event-loop-85caeca391a9)
----
## References
- [Memory Leaks in NodeJS | Quick Overview](https://medium.com/tech-tajawal/memory-leaks-in-nodejs-quick-overview-988c23b24dba)
- [Finding And Fixing Node.js Memory Leaks: A Practical Guide
](https://marmelab.com/blog/2018/04/03/how-to-track-and-fix-memory-leak-with-nodejs.html)
- [Node.js Debugging Guide](https://nodejs.org/en/docs/guides/debugging-getting-started/)
- [Easy profiling for Node.js Applications](https://nodejs.org/en/docs/guides/simple-profiling/)
{"metaMigratedAt":"2023-06-14T19:19:35.402Z","metaMigratedFrom":"YAML","title":"NodeJS CPU heavy tick and memory leak debugging","breaks":true,"disqus":"hackmd","slideOptions":"{\"width\":1000}","contributors":"[{\"id\":\"61af98f4-b303-4819-b08b-aa32cf6677a8\",\"add\":13727,\"del\":2303}]"}