# d3 :bar_chart: :eyes:
## Making sense of data

---
## Aims for the day :thinking_face:
- learn how d3 helps make boring data fun
- find and explore data that we can see in a beautiful and/or enlightening way
- build visualisations using d3
---
## I'm not an expert on d3 :no_good:
However, here are some starting points I have recently found helpful...
---
`index.html`
```html=
<!DOCTYPE html>
<html lang="en">
<head>
<meta charset="UTF-8">
<meta name="viewport" content="width=device-width, initial-scale=1.0">
<link rel="stylesheet" href="index.css">
<title>Pokemon types</title>
<script src="https://unpkg.com/d3@5.16.0/dist/d3.min.js"></script>
</head>
<body>
<svg></svg>
<script src="index.js"></script>
</body>
</html>
```
- import the unpkg script
- add `svg` tags in body
---
`index.css`
```css=
body {
padding:0;
margin:0;
position: fixed;
left: 0;
top: 0;
bottom: 0;
right: 0;
}
svg {
overflow: visible;
}
```
You can also style things directly e.g. `rect`, `text`, `path`, etc once you know what svg thing you'll need.
This is also where you could add `:hover` on individual data points.
---
`index.js`
```javascript=
const { select } = d3;
const svg = select("svg");
const height = document.body.clientHeight;
const width = document.body.clientWidth;
```
Creates the most basic space for full screen visualisation. You'll need to import more d3 methods when you know what you want to do.
---
## Some d3 things

---
### Preparing data
Data visualisation is mostly key-value pairs, something like `[{thing:'a',quantity:6},{thing:'b',quantity:3}]`. Define `render()` then make fetch happen (or get data from local CSV / JSON file). Call `render(data)` once the data has been prepared as above. It might look a bit like this:
```javascript=
function render(data){
// do data visualisation
}
fetch('/data-place').then(res=>res.json()).then(data=>{
// data {pokemon: [{loads of data}x151]}
// prepare data from response i.e. data -> newData
// newData [{type: 'fire', number: 12}x14]
render(newData);
})
```
---
### `.attr()`
Is how to manipulate svgs, i.e. you can add a class, change the height, `transform: translate(x,y)`, change the fill colour and so on.
---
### Transitions look awesome
You can set what you want something to be before `.transition()`, and then what it should be after a `.duration(ms)`. If nothing comes before, d3 assumes 0. e.g. *width* for bar charts. Sometimes if `.transition()` isn't working, it'll be because the attribute (`.attr`) hasnt been initialised before being called - e.g. `color` being `transparent` before fading in. Adding colour, hover response and transitions = easy wow factor.
---
### .domain() - data space
0 people -> 1000000 people
### .range() - screen space
0 pixels -> 500 pixels
**d3 maps real world values into on-screen values**
---
## The visualisation itself is all here
```javascript=
svg
.selectAll('rect') // whatever your visualisation needs
.data(data) // prepared for this moment
.enter() // each data point
.append('rect') // create one new rectangle
.attr('width', d=>d.value) //etc
```
Therefore, you could add `.attr('id',d=>d.name)` and each data point would have the `id` of the data point's `name` value.
---
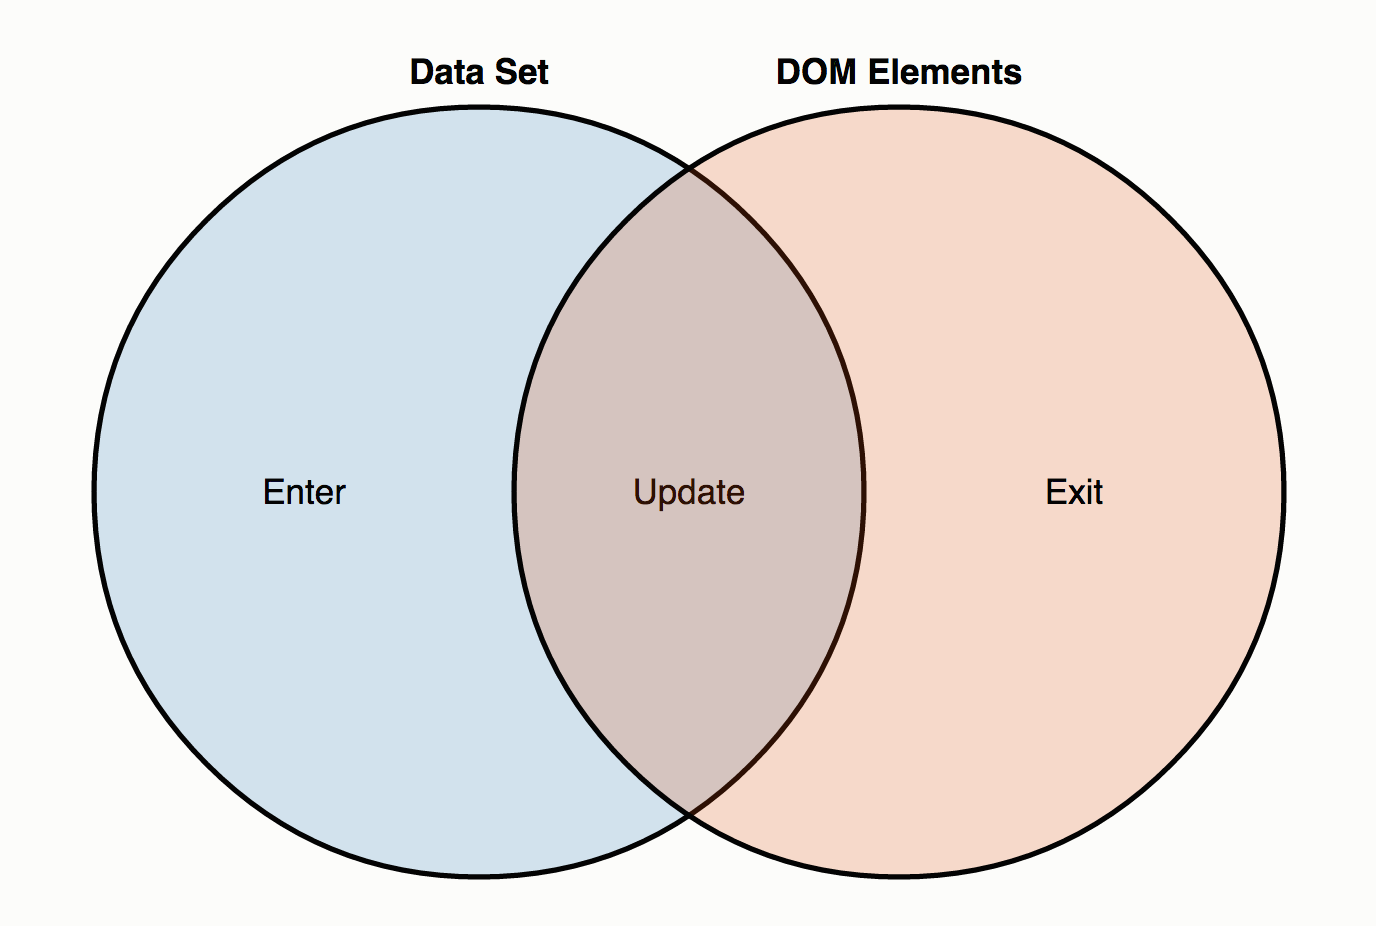
## The enter / update / exit thing
---
### Data vis rules of thumb
[This section](https://youtu.be/_8V5o2UHG0E?t=21895) of the FCC data vis tutorial is useful if you want to know chart best practice and what research shows on, for example, the uselessness of pie charts.

---
# Quick demo!
---
## Two things I've done
- Pokemon types bar chart
- Emotions pie chart
---
### Pokemon types
Gotta fetch em all
```javascript=
fetch('https://raw.githubusercontent.com/Biuni/PokemonGO-Pokedex/master/pokedex.json')
.then(res=>res.json())
.then(data => {
const pokemon = data.pokemon;
pokemon.forEach(pokemon => {
if (types[pokemon.type[0]]){
types[pokemon.type[0]]++;
} else {
types[pokemon.type[0]] = 1;
}
})
const types = Object.entries(typeObj).map(([type, number]) => ({type,number}));
render(types);
});
```
[Site](https://jackherizsmith.github.io/poketypes/)
[Repo](https://github.com/jackherizsmith/poketypes/)
---
### EmotionsBot

[Site](https://jackherizsmith.github.io/slack2d3/)
[Repo](https://github.com/jackherizsmith/poketypes/)
---
## Challenge for today :trophy:
Find some well-structured data with a variety of information, and pick two things out of it that you would like to compare / explore to create a visaulisation of *something you find interesting*.
Bonus points if the visualisation is either nice to look at or teaches us something we didn't know.
---

---
## Resources
- Use this [simplified Pokedex](https://raw.githubusercontent.com/Biuni/PokemonGO-Pokedex/master/pokedex.json) or the [real one](https://pokeapi.co/)
- [JSON datasets](https://github.com/jdorfman/awesome-json-datasets)
- [Inspiration - official d3 examples](https://observablehq.com/@d3/gallery)
- [API reference for standard d3](https://github.com/d3/d3/blob/master/API.md) - there's so so much here. Too much. But ctrl+f to find something that might help, each one links to an example usage
- [Mike Bostock's](https://bl.ocks.org/mbostock) blocks are worth looking at for inspiration and great code snippets (he made and maintains d3)
- [FreeCodeCamp 12.5 hr YT tutorial - segmented by chart type](https://youtu.be/_8V5o2UHG0E?t=11722) - ignore the first 3:15 hours also you can watch at 2x speed.
---
```javascript=
const {
select,scaleLinear,max,scaleBand,axisLeft,axisBottom
} = d3;
const svg = select("svg");
const height = document.body.clientHeight;
const width = document.body.clientWidth;
function render(data){
const xValue = d => d.number;
const yValue = d => d.thing;
const margin = { top: 20, right: 40, bottom: 30, left: 100 };
const innerWidth = width - margin.left - margin.right;
const innerHeight = height - margin.top - margin.bottom;
const xScale = scaleLinear()
.domain([0, max(data, xValue)])
.range([0, width-100]);
const yScale = scaleBand()
.domain(data.map(yValue))
.range([0, innerHeight])
.padding(0.1);
const g = svg
.append("g")
.attr("transform", `translate(${margin.left}, ${margin.top})`);
const xAxis = axisBottom(xScale).tickSize(-innerHeight);
g.append("g").call(axisLeft(yScale));
const xAxisG = g.append("g")
.call(xAxis)
.attr("transform", `translate(0, ${innerHeight})`)
g.selectAll("rect")
.data(data)
.enter()
.append("rect")
.attr("y", (d) => yScale(yValue(d)))
.attr("height", yScale.bandwidth())
.transition().duration(2000)
.attr("width", (d) => xScale(xValue(d)))
}
const data = [
{
thing: 'a',
number: 3,
},
{
thing: 'b',
number: 8,
},
{
thing: 'c',
number: 5,
},
];
render(data);
```
{"metaMigratedAt":"2023-06-15T10:28:07.541Z","metaMigratedFrom":"Content","title":"d3 :bar_chart: :eyes:","breaks":true,"contributors":"[{\"id\":\"3bd43981-0858-4e2b-a511-ecd7fba2d230\",\"add\":9889,\"del\":2284}]"}