#
<p style="text-align: center"><b><font size=5 color=blueyellow>Practical Machine Learning - Day 3</font></b></p>
:::success
**Practical Machine Learning — Schedule**: https://hackmd.io/@yonglei/practical-ml-2025-schedule
:::
## Schedule
| Time | Contents |
| :---------: | :------: |
| 09:00-09:05 | Soft start |
| 09:00-10:25 | Unsupervised Learning (I): Clustering |
| 10:25-10:35 | Break |
| 10:35-11:55 | Unsupervised Learning (II): Dimensionality Reduction |
| 11:55-12:00 | Wrap-up and Q&A |
---
## Exercises and Links
:::warning
- Exercises for [XXX]()
:::
## ENCCS lesson materials
:::info
- [**Practical Machine Learning**]()
- [**Introduction to Deep Learning**](https://enccs.github.io/deep-learning-intro/)
- [**High Performance Data Analytics in Python**](https://enccs.github.io/hpda-python/)
- [**Julia for high-performance scientific computing**](https://enccs.github.io/julia-for-hpc/)
- [**GPU Programming: When, Why and How?**](https://enccs.github.io/gpu-programming/)
- [**ENCCS lesson materials**](https://enccs.se/lessons/)
:::
:::danger
You can ask questions about the workshop content at the bottom of this page. We use the Zoom chat only for reporting Zoom problems and such.
:::
## Questions, answers and information
- Is this how to ask a question?
- Yes, and an answer will appear like so!
### 7. [Unsupervised Learning (I): Clustering](https://enccs.github.io/practical-machine-learning/07-unsupervised-ML-clustering/)
- Can unsupervised learning be used in the analysis of data that was generated using known equations (e.g. CFD results) or should we always used supervised learning for this kind of data?
- I tend to say, yes, unsupervised learning might scale better if
- there is a lack of labelled data, or
- we are looking for unknown features.
- if you have lots of data, some (a small amount) are labelled, and the others are unlabeled, you can also use semi-supervised learning methods
- One CFD-related application would be detecting coherent structures.
- However if it is possible to use some other reduced order method to generate labels, maybe supervised learning can be beneficial.
- Turbulence has multiscale, chaotic dynamics and stochastic-like statistics. Which ML approaches work best here?
- It is an open research question, hard to answer. There are people which use deep-learning nets such as LSTM and Transformers to train on time and spatial information. You can also think of doing something simpler such as regression to discover relationships to form turbulence models.
- Where does AlphaFold use supervised/unsupervised learning, what’s classification vs regression, and how do you avoid train leakage from homologous (very similar) protein sequences? In low-confidence regions, AlphaFold can produce physically impossible features like a model for a car with five wheels.
- AlphaFold uses supervised learning relying on Protien data base (PDB) data to make initial training and then generate more data inferred from the neural network, and repeats the process.
- In terms of algorithms, it is a unique network architecture.
- ==You didn't split the data in training and test but use the full set for the evaluation. Is that always the case for unsupervised learning?==
- Good question. Let's ask @yonglei.
- YW: Yes, because there is no label!
- if make predictions (if the algorithm can), we don't the prediction is right or wrong
- in this tutorial, it is because we have labels for the penguins dataset, we can make comparisons. if we don't have lables, it is difficult to make comparison. we can only judge if the obtained clusters are reansonable or not
- Absolutely. But couldn't we split the cluster in a training and test dataset, then do unserpised training on the training dataset, then apply the model on the testdata and finally evaluate only the performance of the model on testdata. This could be interesting if you develop a method on some data in the past, and then apply it to sme data that will be collected in the future (say weather type classification)
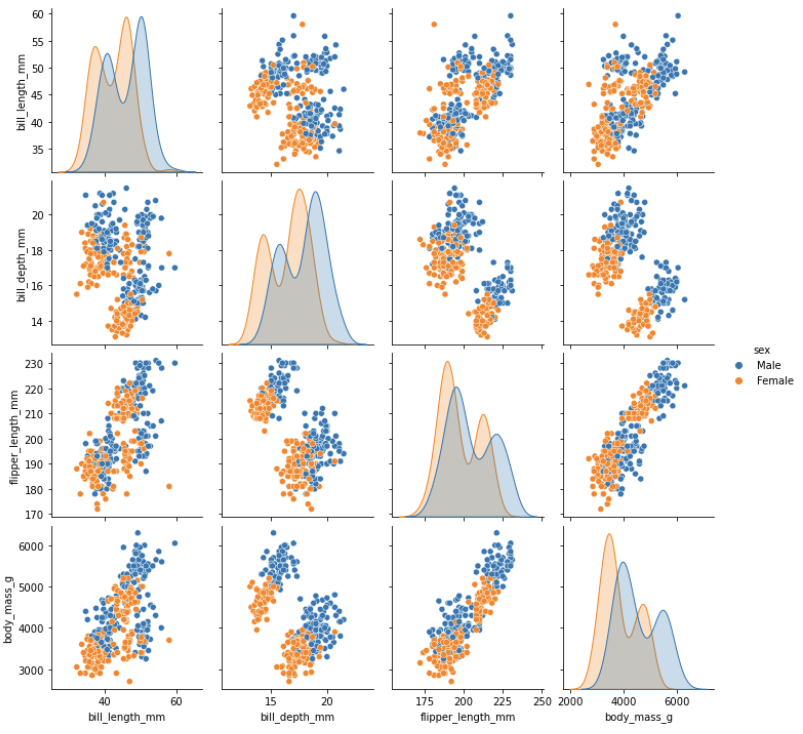
- `k=2` perhaps corresponds to "male/female" grouping.
- If you choose the input features correctly one could acheive that. However, that is not the case here. The body mass variation between species is much higher than that between genders.
- don't we train against `X = penguins_clustering[['bill_length_mm', 'bill_depth_mm', 'flipper_length_mm', 'body_mass_g']]`
- Yes. I meant to say that (and I'm guessing here), if we drop the `body_mass_g` column and maybe also drop the `flipper_length_mm` column we may distinguish genders better.
- Pair plot: made using `sns.pairplot(penguins, hue='sex')`
- 
- Do we pretend now that we don't know number of different species and number of penguins in each species? for the matter of unsupervised learning...
- Exactly. We only have the input features `X` / `X_scaled` and (we pretend to have) no labels `y`.
- I would appreciate receiving some "homework" assignments so I can apply the knowledge I’ve acquired. Please don’t hesitate to make them challenging.
- Iris data set is good exercise for doing a similar classification of flowers. See: https://en.wikipedia.org/wiki/Iris_flower_data_set
- Start with `from sklearn.datasets import load_iris; iris = load_iris()`
- NYC taxi trip duration challenge for regression tasks: https://www.kaggle.com/c/nyc-taxi-trip-duration
- there are more datasets (mentioned in [collecting data section](https://enccs.github.io/practical-machine-learning/04-data-preparation-for-ML/#collecting-data-from-multiple-sources)), like iris, titanic, boston housing (might be california housing), and wine dataset
- scikit-learn also provided lots of examples for varied tasks
- check scikit-learn documentation
- All clustering examples were for 2-d datasets. Do these methods also work for more dimensions? And the scores?
- it works for high dimensional data, a challenging thing is that it is difficult for visualization
- a better way is that we first reduce the dimension and then apply clustering algorithms to classify data points to differnet clusrters
- this will be coverd in next episode
### 8. Unsupervised Learning (II): Dimensionality Reduction
- Please, which is the book you refer to about PCA? Thanks
- I think YW was quipping about the science-fiction book, *The Three-body problem*.
- If we have 4 features and 4 components (which are linear combinations of features) does that mean that only coefficients that are in front of the features in linear combinations are different in these components?
- What is the purpose of this if we didn't reduce dimensionality? We started at 4 and ended at 4...
- It is true that with 4 there is no reduction. What YW is trying to explain is the information loss by limiting to 2 or 3 PCA components and where to stop. With 4 components there is no loss of information.
- PC=4 is a special case I want to show tht how many PC we really need if we want to keep (enough) information in new space (PCs), 90? 95? or 99?
- from the obtained accumultative ratios, you can decide how many components to adopt in your model
- from 4 features to 2 components, it is dimentionality reduction
- from 4 features to 4 components, it is just variable transformation (1st component contains most information, 2nd component contains second most information, ...), it it not dimensionality reduction as 100% information in original dataset is retained.
- Is there a condition of independence for features in PCA?
- Do you mean orthogonality? Yes.
- Yes, PCA works out new orthogonal axes.
- Sorry, didn't mean that. Do we have to be sure that bill_length, bill_depht and other two features are not correlated between each other in order to perform PCA?
- Ideally there should be some underlying correlation or relation. If it is random, PCA won't be quite effective, since it is a linear combination of the features.
- Thank you very much, this was really helpful. However, what I still don't understand (and please excuse my ignorance) is how you could apply this on images (2-d). It doesn't make sense to have columns "i", "j", and the values in these points, and then run any clustering on this. Or am I missing something?
- In case of images you could perform PCA on colour 2channels (RGB or even more in case of sattelite images).
- Does this mean you simply represent the 2-d image as a set of 1-d vectors? Don't you then loose the information about the neighbours?
- Which dimensionality reduction method do you recommend for regression method?
- if you say regression, it should be UMAP
- t-SNE cannot do the predictive task
- I meant under supervised method.
- dimensionality reduction methods are unsupversed learning methods, and the algorithms can only reduce dimentionality, they can not be used for classification/regression tasks. you have to use classification-based or regression-based methods for following task
- I think method like Partial Least Squares (PLS) uses supervised dimensionality reduction for regression application but I have never used it.
- One question, My UMAP scatter plots look different than the example notebook, with the same parameters
- All other outputs match, exept for the UMAP scatter plots
- Yes, you are right. There are some randomness for the dimensional reduction. If you run the code multiple times, we can observe the difference.
- The propose of these algorithms is just to reduce dimensionality of dataset. it has kind of stochastic features, which means that it uses randomness during initialization and optimization. That’s why each run can give you a slightly different embedding (and plot), even if you use the same data.
:::danger
*Always ask questions at the very bottom of this document, right **above** this.*
:::
---
 Sign in with Wallet
Connect another wallet
Sign in with Wallet
Connect another wallet