# Meeting
# 2nd Meeting 06/19/2018
###### tags: `Machine Learning - Internship at BMW Lab NTUST 2018`
# RNN
## RNN Architecture
There is a lot of RNNs architecture, there are:
* Fully recurrent
* Independently recurrent (IndRNN)
* Recursive
* Hopfield
* Elman networks and Jordan networks
* Echo state
* Neural history compressor
* **Long short-term memory**
* **Gated recurrent unit**
* Bi-directional
* Continuous-time
* Hierarchical
* Recurrent multilayer perceptron network
* Multiple timescales model
* Neural Turing machines
* Differentiable neural computer
* Neural network pushdown automata
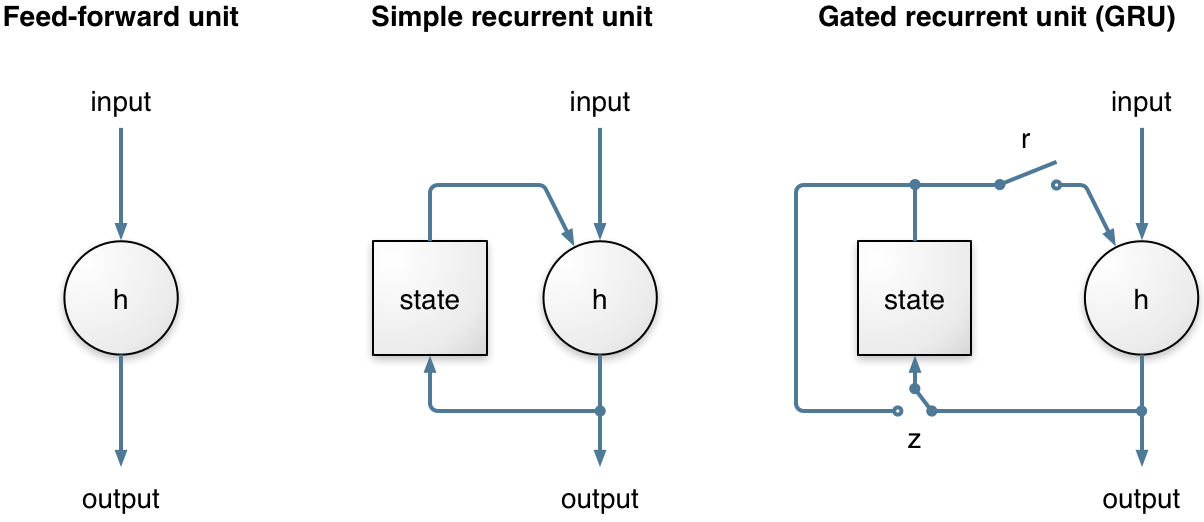
Artificial neural network, conections between nodes form directed graph along a sequence. it makes exhibit dynamic temporal behavior for time sequence. Different with feedforward neural networks. RNN's **use internal state(memory) to process sequence of input**. it will makes them applicable to task such as unsegemented, connected handwriting recognition, or speech recognition. RNN used two broad classes of network with a similar general structure, one is **finite** and the other one is **infinite pulse**.
Basic RNN are a network of neuron, each of neuron with a direct connection to every node. each node has a time varying real valued activation. each connection(Synapse) has a modifiable real valued weight
3 nodes :
1. input nodes
2. output nodes
3. hidden nodes
* Gate Recurrent Unit(GRU)
are a gating mechanism in RNN. Used in the full form and several simplified variants. There are several variations on the full gated unit, with gating done using the previous hidden state and the bias in various combinations, and a simplified form called minimal gated unit. There are 2 gates, Reset and Update gates. The update gate helps the model to determine how much of the past information (from previous time steps) needs to be passed along to the future. Reset gate is used from the model to decide how much of the past information to forget
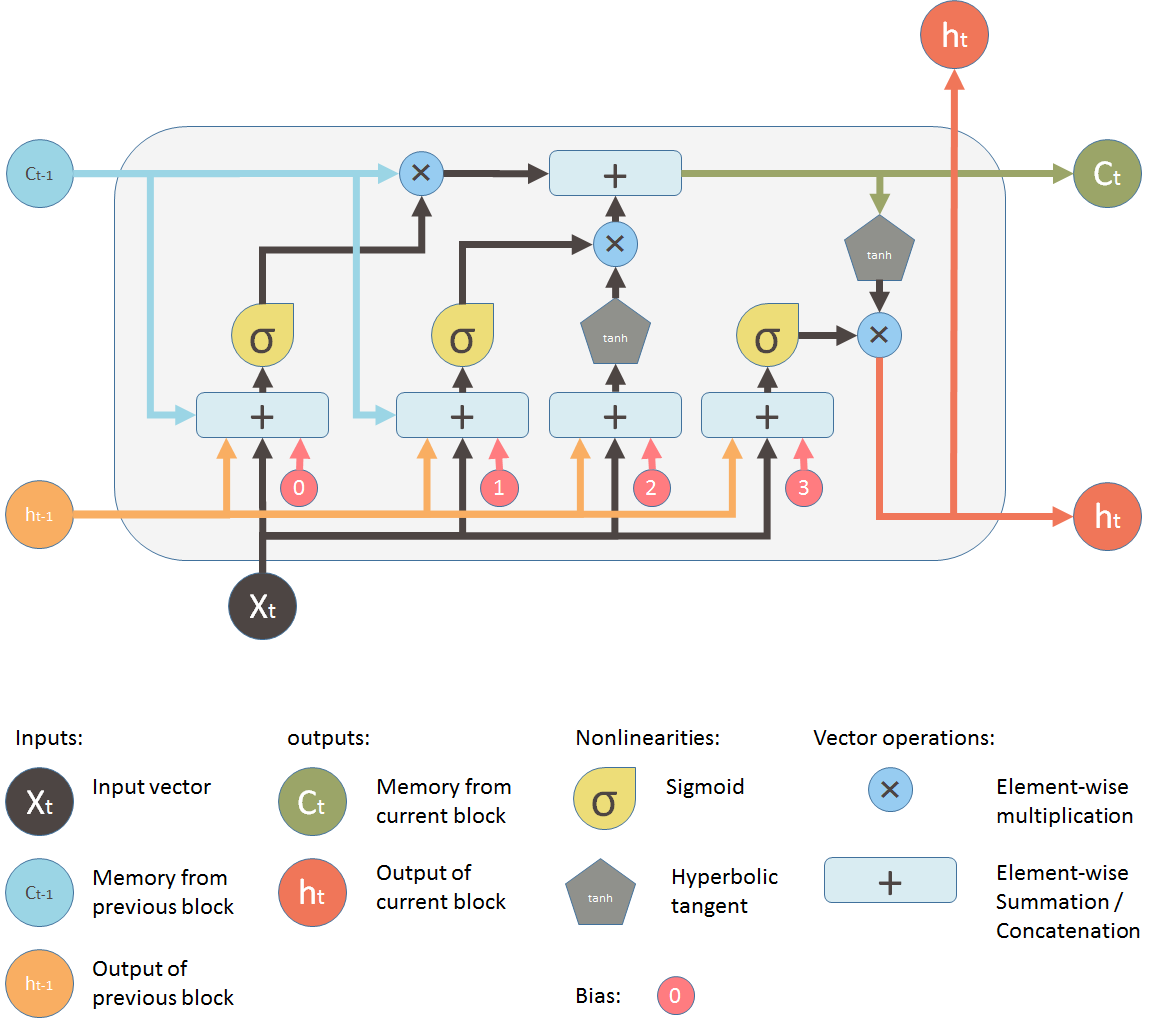
* LSTM
is Deep learning system which it avoids the vanishing gradient problem. LSTM is normally augmented by recurrent gates called "forget" gates. LSTM prevents backpropagated error from vanishing or exploding. The errors can flow backwards through unlimited numbers of virtual layers unfolded in space. LSTM can learn tasks that require memories of events that happened thousands or even millions of discrete time steps earlier.
The propblem is Topologies in LSTM can be evolve.
From now, many app use stacks of LSTM RNNs and train them by Connectionist Temporal Classification(CTC) to find an RNN weight matrix that maximazes the probability of the label sequences in a training set, given corresponding input sequences. CTC achieves both alignment and recognition.
LSTM can learn to recoginize context-sensitive language unlike previous models based on hidden Markov Models(HMM) and similar concepts.
**Note** : CTC
is a type of neural network output and associated scoring function, for training RNN such as LSTM networks to tackle sequence problems where timing is variable
**Note** : HMM
is a statistical Markov model in which the system being modeled is assumed to be a Markov process with unobserved states
**The key difference between a GRU and an LSTM:**
* GRU has two gates, which is reset and update gates
* LSTM has three gates, which is input, output and forget gates
* The GRU unit **controls the flow of information like the LSTM unit**, but **without having to use a memory unit**. It just exposes the full hidden content without any control
* GRU is relatively new, and from my perspective, the performance is on part with LSTM, but computationally more efficient (less complex structure as pointed out).
* GRUs train faster and perform better than LSTMs on less training data if you are doing language modeling
* GRUs are simpler and thus easier to modify, for example adding new gates in case of additional input to the network. It's just less code in general.
* LSTMs should in theory remember longer sequences than GRUs and outperform them in tasks requiring modeling long-distance relations.
Why are RNN/LSTM preferred in time series analysis and not other NN?
---
1. The NN just have to be deep enough to model the time connections
2. RNNs are just used, because they are faster
3. With RNN the older (e.g. t-20) timepoints are not that relevant in comparison to the newer timepoints (e.g. t-1), because the data from older timepoints have to go through all neurons until the weight is updated in this neuron.
4. It is easier to understand the weight matrix of normal NN in comparison to RNN to understand partly the behavior of the NN
5. It can consider the time better in comparison to a sliding window approach especially if the length of the sequence is quite long
Implementation
----


# 3rd Meeting 06/25/2018
Implementation machine learning with keras using sckit learning, pandas, and numpy
---
1. First import everything that we needed, such as layers, model, and library. Numpy for numerical in python, use pandas for data strcture and data analysis, use sequential models, for the layer is Dense(2D), use sklearn for learning algorithm.

2. set random seed for reproducibility
3. read dataset using pandas
4. divide dataset into numerical and string

5. this is the dataset that divided before


6. encode the labels for transform labels to normalized encoding
7. define a model
8. add sequential model
9. add dense with hidden nodes=8, input = 4
10. Compile


<br>
**<center>Predicting Remaining Useful Life using Time Series Embeddings based on Recurrent Neural Networks</center>**
RUL : Remaining useful life
HI : Health index
<br>
Challenges :
**1. Health degradation trend**
In complex machines with several components, it is difficult to build physics based models for health degradation analysis
**2. Noisy sensor readings**
Sensor readings often suffer from varying levels of environmental noise which entails the use of denoising techniques. The amount of noise may even vary across sensors.
**3. Partial unavailability of sensor data**
Multiple components interact with each other in a complex way leading to complex dependencies between sensor readings
**Why use RNN to solve the challenges ?**
RNN is used as an encoder to **obtain a fixed-dimensional** representation that serves as an embedding for multi-sensor time series data
**Their Approach :**
RUL estimation **does not rely on degradation trend assumptions**, can **handle noise** and **missing values**, and can **capture complex temporal dependencies** among the sensors
**Reasons used RNN for Health Monitoring**
The key idea behind using RNNs for health monitoring is to **learn a temporal model of the system** by capturing the complex temporal as well as instantaneous dependencies between sensor read
RNNs espicially base on LSTM or GRUs have been successfully used to achieve state-of-the-art results on sequence modeling tasks such as machine translation and speech recognition

<center> Figure of Systems </center>
**Usage of RNN autoencoder**
Autoencoder have have been used to **discover interesting structures** in the data by means of regularization
RNN autoencoder useful for **RUL estimation** in which the RNN-based model **learns to capture** the behavior of a machine by **learning to reconstruct multivariate time series** corresponding to normal behavior in an unsupervised manner
**Multilayered RNN with dropout**
This paper used Gated Recurrent Units in the hidden layers of sequence-to-sequence autoencoder. The dropout use for **regularization** and is applied only to the non-recurrent connections, ensuring information flow across time-steps

<center> Gates in GRU </center>
**How does it work**
from this figure we can conclude that:

<center> Figure of Systems </center>
<br>
**RUL ESTIMATION USING EMBEDDING**
the system has **input time series** which it **divided into windows**. Each window is **passed through an RNN Encoder** to obtain its embedding. The embedding z~t~ at time *t* is compared with the embeddings in set Z~norm~ of normal embeddings to obtain health estimate *h~t~* *(t = 1,....,T)*. The HI curve is then compared with HI curves of failed train instances in set *H* to obtain the RUL estimate *R'*.
A fixed-dimensional representation or embedding for each such window is **obtained using an RNN Encoder** that is trained in an unsupervised manner using RNN-ED
**RNN-ED train** using time series subsequences from the entire operational life of machines
**The RNN Encoder** is likely to retain the important characterstics of machine behavior in the embeddings, and therefore discriminate between embeddings of windows corresponding to degraded behavior from those of normal behavior
Reason of using the embedding for a window **to estimate the health** of the instance at the end of that window.
**Obtaining Embeddings using RNN Encoder-Decoder**
RNN Encoder-Decoder (RNN-ED) networks based on **sequence-to-sequence (seq2seq) learning framework**.
**a seq2seq model** consists of a pair of multilayered RNNs trained together: an encoder RNN and a decoder RNN

<center> work of encoderdecoder pair for a sample time series x1, x2, x3 </center>
<br>
the encoder RNN iterates through the points in the time series to compute the final hidden state, same with encoder, The decoder RNN has the same network structure as the encoder, and uses the hidden state as its initial hidden state
The RNN-ED is **trained to minimize** the loss function given by the squared reconstruction error.
On **final hidden state**, an additional input is given to the decoder RNN at each time step. This input is the output of the decoder RNN at the previous time step
In this section they do not give any additional input. This ensures that the final hidden state of encoder retains all the information required to reconstruct the time series back via the decoder RNN

this is a typical example of input and output from RNN-ED, where the smoothed reconstruction suggests that the embeddings capture the necessary pattern in the input and remove noise
**Handling Missing values on system**
The system include masking and delta vectors as additional inputs to the RNN-ED at each time instant. The masking vector helps to identify the sensors that are missing at time t, and the delta vector indicates the time elapsed till t, from the most recent non-missing values for sensors in the past
**Obtaining HI Curves using Embedding**
The RNN Encoder captures the important patterns in the input time series subsequences, the embeddings thus obtained can be used to differentiate between normal and degraded regions in the data
---
**RUL Estimation using HI Curve**
To estimate the RUL for a test instance (i^∗^), its HI curve h^(i∗)^ is compared with the HI curves in H. The initial health of a train instance and a test instance need not be same. We therefore allow for a time-lag t~D~ in comparing the HI curve of test instance and train instance

**EXPERIMENTAL EVALUATION**
**Use 2 datasets:**
1. a publicly available C-MAPSS Turbofan Engine dataset (contains time series of readings for 24 sensors for 100 train instances (train FD001.txt) of turbofan engine from the beginning of usage till end of life)
2. a proprietary real-world pump dataset (contains hourly sensor readings for 38 pumps that have reached end of life and 24 pumps that are currently operational)
**Tools :**
* Tensoflow library (for implementing the various RNN models)
**Performance on Engine dataset**


each variant of embedding distance based approach perform better than the corresponding variant of reconstruction error based approach in terms of timeliness score S
# 4th Meeting 07/02/2018
Implementation machine learning with keras using sckit learning, pandas, and numpy
---

<br>**Cell 1** : Import library and learning algorithm
**Cell 2** : read dataset using pandas and combine train and test data.
**Cell 3** : Check the topic of table column
**Cell 4** : Check partial(head) content of dataset

**Cell 5** : Check partial(tail) content of dataset
**Cell 6** : Check info of train data
**Cell 7** : Check statistic information each column
**Cell 8** : Check information of object
This section(cell 9 - 39) is for data analyzing. We can take conclusion about data
**Cell 9** : Classified Pclass with Survived data

**Cell 10** : Classified Sex with Survived data
**Cell 11** : Classified SibSp(siblings) with survived data
**Cell 12** : Classified Parch(family relation) with Survived data

**Cell 13** : create comparison between Age and Survived with graph
**Cell 14** : create comparison between Pclass and survived with graph
and the others(until cell 39) are same puporse which is to data analizing. we can take conclusion that, female have a big probability to survive


Kind of models :
- Random Forest :
build some or many trees, each tree has a random classified, the more trees that we build, more accuracy that we got. Trees that have most vote will be choose.
**Advantage** : both classification and the regression of task, handle some missing values and maintain accuracy for missing data, random forest model will not overfit the model, handle large dataset with dimensionality.
For the **disadvantage** of this model is good for classification but not good for regression,/ little control on what model does

- SVM(support vector machine)
This models usually use for extreme cases. The goal of this model is to design a hyperplane that classifies all training vector in two classes. the best hyperplane leaves the maximum margin from two classes.
**Advantage** : effective in high dimensional spaces, when number of dimension is higher than samples it will be more memory efficient(because it uses subset traning points in decision function), and different kernel can be used for various decision function.
**Disadvantage**: poor performance for samples>features, SVM does not provide probability estimation

- KNN(Nearest Neighbour)
as the name of the model, the prediction will be given by the nearest neighbour in the vectors. similar with SVM but a little bit different. there is no hyperplane to measure the margin, but it will draw a circle then measure the margin through the nearest one and give the prediction.
**Advantage**: Robust to noisy data, effectiv/e if the training data is large, no training phase, learns complex models easily.
**Disadvantage** : need to determine value of the parameter K, not clear which type of distance metric to use, computation is high, k-dimension tree may ease computation.

- Gaussiannb
Gaussian Naive Bayes algorithm for classification. Naive Bayes methods are a set of supervised learning algorithms based on applying Bayes’ theorem with the “naive” assumption of independence between every pair of.

# 5th meeting, 07/10/2018 Present about the paper and main concept about RNN and LSTM
Still discussing with nina about the paper presentation. Next plan, ask prof ray to more suggestions about the paper
# 6th meeting, 07/16/2018 Present about the paper and main concept about RNN and LSTM, 1st paper, and second paper
## Code Problem
### Description
There is some code that given from this github https://github.com/dev-rkoshlyak/mlinseconds.git
Purpose of this problem is to design and learn neural network in such way, that it would be able to learn Xor function.
The fuction table for Xor function is:
00 => 0
01 => 1
10 => 1
11 => 0


### Problem Solved

The model use 3 hidden layer, 2 input, and 1 output to solve XOR problem. Main key of this problem is design the model
## Link
[RNN and LSTM](https://drive.google.com/open?id=1Ay1oyKzoURApVjd6pVcfOk7lPW9_mb4M)
# 7th meeting, 07/23/2018 Present about Progress of implementation using dispenser data, the paper that have read before. 1st paper, and second paper
## Progress
- Successfully separate the data
- Another problem is time forecasting in dispenser data, which mean it has null value and it could not just erase it from data
**Clustering** is the task of grouping together a set of objects in a way that objects in the same cluster are more similar to each other than to objects in other clusters
**K-Value** : before clustering using K-means, we must know the number of K(Usually 1-10)
**How to know the right number of K value**
There are many ways to get right number of K value
- Using Matlab
- Using Elbow method
[1st paper](https://drive.google.com/open?id=1gpkcgt-BNqfY7heTn6XVp8tDs7GE0s13)
[2nd paper](https://drive.google.com/open?id=1y2T8BO0nlxXVCNAVTsGRZWLDU5T16jXy)
# 8th meeting, 07/30/2018 Present about the implementation using dispenser data and second paper
## Convert unix to date time in python

## After revise the code
What have done in this change :
- Filtering data(use certain machine's mac address)
- change the batch size and epoch
- fill the null value with mean data
- Best way is classifie the data with time, such as each hour or day.
## Result

## RMSE
Root Mean Square Error (RMSE) is the standard deviation of the residuals (prediction errors). Residuals are a measure of how far from the regression line data points are
RMSE is a measure of how spread out these residuals are.