---
tags: Python
---
# 使用YOLO辨識K線圖
* [安裝GIT](https://git-scm.com/)
* [安裝Pytorch](https://pytorch.org/get-started/locally/)
* [安裝CUDA(選擇性)](https://developer.nvidia.com/zh-cn/cuda-downloads?target_os=Windows&target_arch=x86_64&target_version=10&target_type=exelocal)
* pip install [mplfinance](https://github.com/matplotlib/mplfinance)
* `git clone https://github.com/ultralytics/yolov5`
* `cd yolov5`
* `pip install -r requirements.txt`
* 新增`yolov5/train.yaml`
```yaml=
train: train/
val: train/
# number of classes
nc: 2
# class names
names: ['sell','buy']
```
## 自動產生資料集
### 引入套件
```python=
import os
import sqlite3
import numpy as np
import pandas as pd
import matplotlib.pyplot as plt
import matplotlib.patches as patches
import matplotlib.dates as mpl_dates
from mplfinance.original_flavor import candlestick_ohlc
```
### 建立資料夾
```python=
os.makedirs('yolov5/train/images', exist_ok=True)
os.makedirs('yolov5/train/labels', exist_ok=True)
```
### 讀取資料庫
取得資料庫請參考[分析系統建置/步驟一](https://hackmd.io/dBWiFw-qQIiwGqx5QGrVyQ?view)
```python=
symbol = 2330
with sqlite3.connect('flaskr.db') as con:
sql = f'SELECT Date,Open,High,Low,Close FROM TW{symbol};'
df = pd.read_sql(sql, con)
df['Date'] = pd.to_datetime(df['Date']).apply(mpl_dates.date2num)
```
### 技術指標與交叉點
```python=
ROLL = 1 # 框框半徑
# 技術指標
DATE,O,H,L,C = df['Date'],df['Open'],df['High'],df['Low'],df['Close']
FAST = C.rolling(12).mean().values
SLOW = C.rolling(26).mean().values
# 交叉點
rects = []
pos = FAST[ROLL]>SLOW[ROLL]
for i in range(ROLL,len(SLOW)):
curPos = FAST[i]>SLOW[i]
if curPos != pos:
arange = range(i-ROLL,i+ROLL)
x = DATE[i-ROLL]
y = min(*FAST[arange],*SLOW[arange])
w = 2*ROLL
h = max(*FAST[arange],*SLOW[arange])-y
label = 1 if curPos else 0
rects.append((i,label,x,y,w,h))
pos = curPos
```
### 繪圖
```python=
STRIDE = 30 # 時窗
DOHLC = df[['Date', 'Open', 'High', 'Low', 'Close']].values
for j in range(0,len(df),STRIDE)[1:]:
range_rects = [r for r in rects if j<r[0] and r[0]<j+STRIDE]
# 跳過沒有標記的
if not range_rects:
continue
# 畫蠟燭線、技術折線,圖片尺寸=fig.get_size_inches()*fig.dpi
fig, ax = plt.subplots()
candlestick_ohlc(ax, DOHLC[j:j+STRIDE,:], width=0.6, colorup='green', colordown='red', alpha=1)
ax.plot(DATE[j:j+STRIDE],FAST[j:j+STRIDE])
ax.plot(DATE[j:j+STRIDE],SLOW[j:j+STRIDE])
# 畫方框
for i,label,x,y,w,h in range_rects:
patch = patches.Rectangle((x,y), w, h, linewidth=1, edgecolor='r', facecolor='none')
ax.add_patch(patch)
# 標題刻度
ax.xaxis.set_major_formatter(mpl_dates.DateFormatter('%Y-%m-%d'))
fig.autofmt_xdate()
plt.axis('off')
fig.tight_layout()
# 儲存圖片、標籤
date_str = mpl_dates.num2date(x).strftime('%Y-%m-%SLOW')
plt.savefig(f'yolov5/train/images/{symbol}-{date_str}.jpg')
```
### YOLO圖片格式
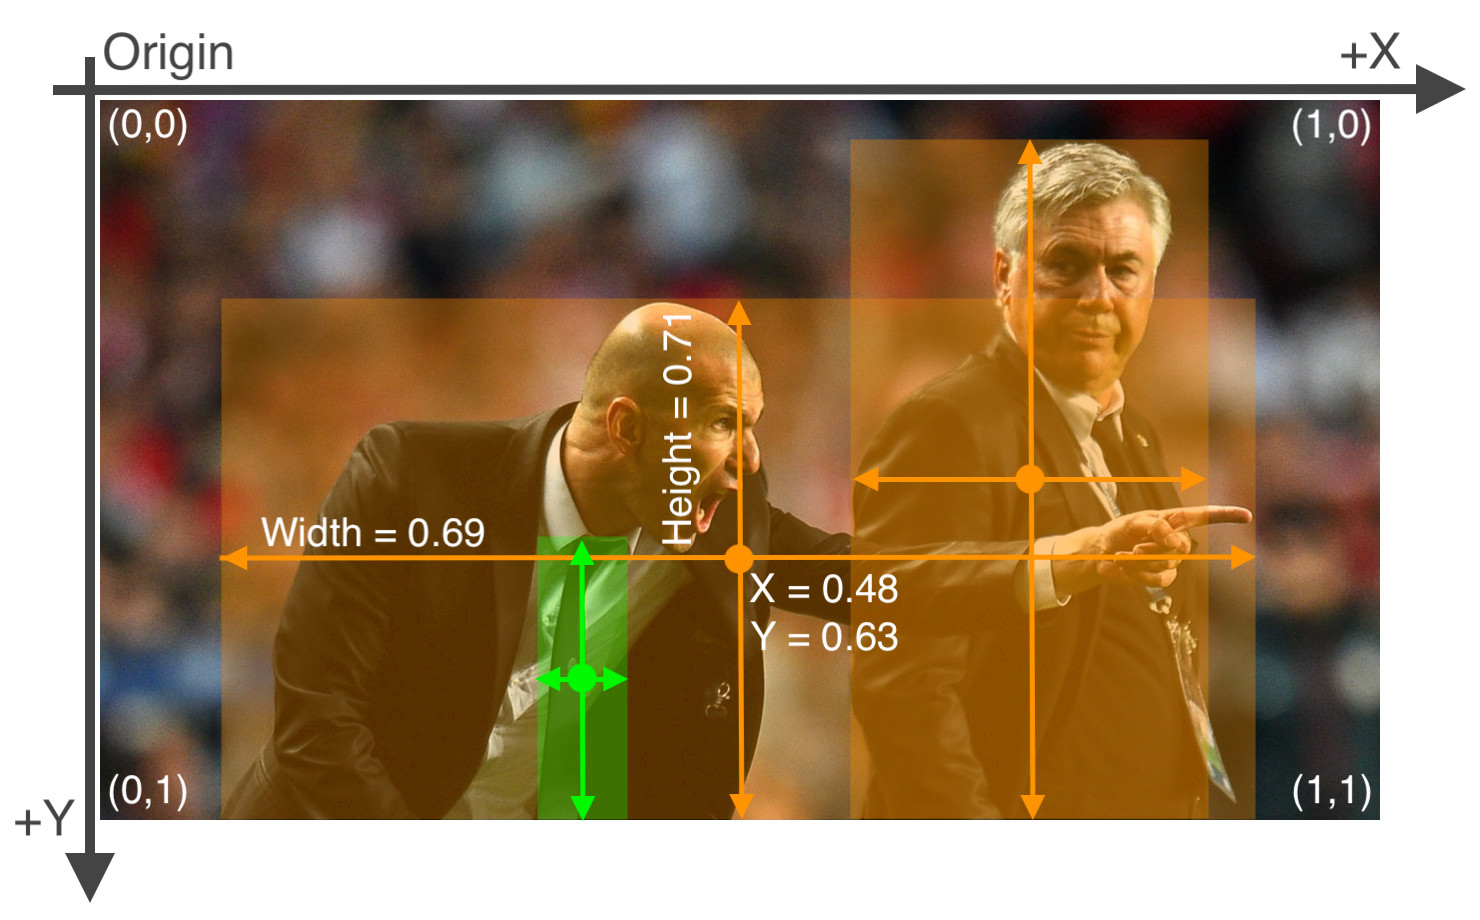
```python=
# 將左下至右上的數值,轉換成由左上至右下的圖片的pixel絕對座標,同時正規化成[0,1]
def yolo_formatter(x,y,w,h,fig,ax):
width, height = fig.canvas.get_width_height()
left, bottom = ax.transData.transform([x,y])
right, top = ax.transData.transform([x+w,y+h])
w = round((right-left)/width,2)
h = round((top-bottom)/height,2)
cx = round((right+left)/2/width,2)
cy = round(1-(top+bottom)/2/height,2)
return cx,cy,w,h
```
### 產生標籤檔
```python=
# 寫入標籤文字檔
with open(f'yolov5/train/labels/{symbol}-{date_str}.txt','w') as f:
text = ''
for i,label,x,y,w,h in range_rects:
cx,cy,w,h = yolo_formatter(x,y,w,h,fig,ax)
text += f'{label} {cx} {cy} {w} {h}\n'
f.write(text)
# 最後記得清空繪圖記憶體
plt.close()
```
檔案`2330-2018-10-01.txt`內容:
```
1 0.24 0.27 0.04 0.03
0 0.36 0.33 0.04 0.06
1 0.84 0.5 0.04 0.01
```
## 訓練、偵測
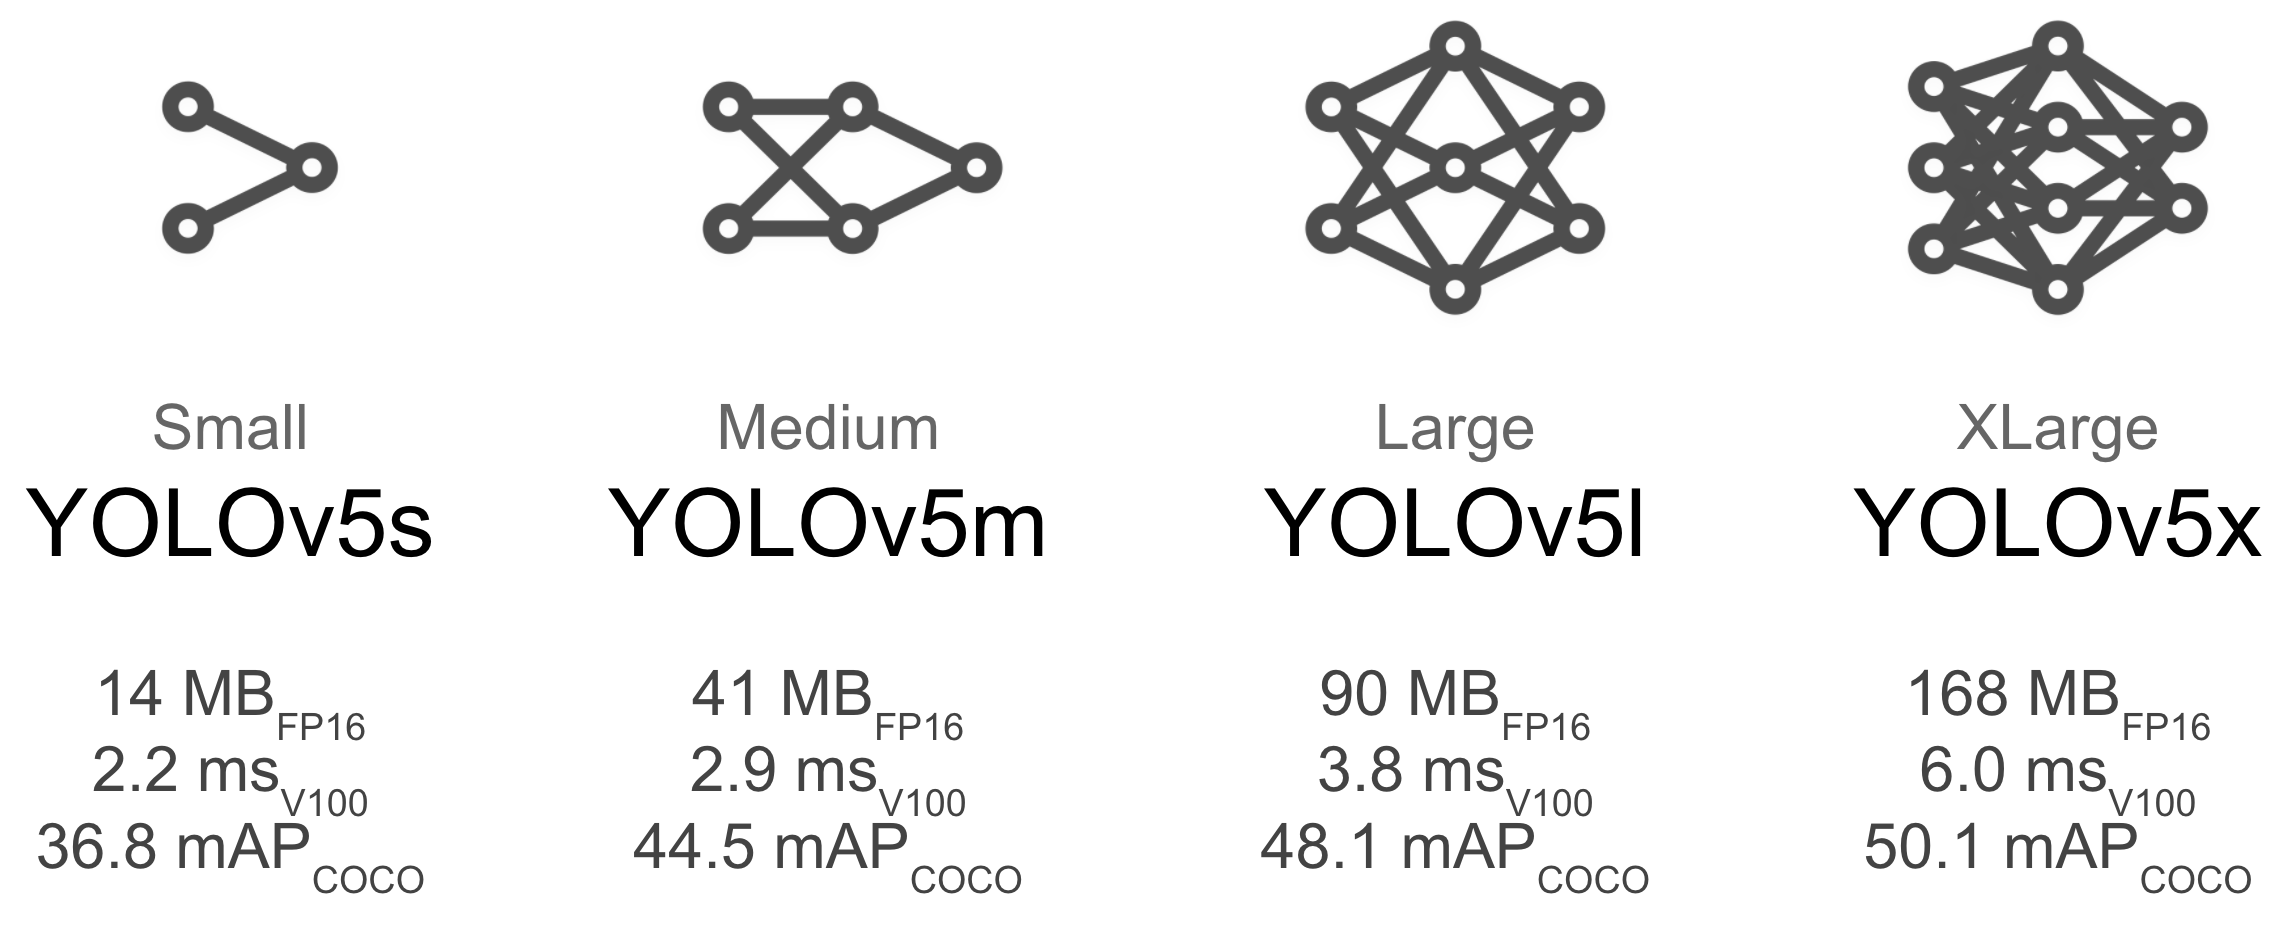
### 模型選擇
### 超參數設定
```yaml=
lr0: 0.01 # initial learning rate (SGD=1E-2, Adam=1E-3)
lrf: 0.2 # final OneCycleLR learning rate (lr0 * lrf)
momentum: 0.937 # SGD momentum/Adam beta1
weight_decay: 0.0005 # optimizer weight decay 5e-4
warmup_epochs: 3.0 # warmup epochs (fractions ok)
warmup_momentum: 0.8 # warmup initial momentum
warmup_bias_lr: 0.1 # warmup initial bias lr
box: 0.05 # box loss gain
cls: 0.5 # cls loss gain
cls_pw: 1.0 # cls BCELoss positive_weight
obj: 1.0 # obj loss gain (scale with pixels)
obj_pw: 1.0 # obj BCELoss positive_weight
iou_t: 0.20 # IoU training threshold
anchor_t: 4.0 # anchor-multiple threshold
# anchors: 3 # anchors per output layer (0 to ignore)
fl_gamma: 0.0 # focal loss gamma (efficientDet default gamma=1.5)
hsv_h: 0.015 # image HSV-Hue augmentation (fraction)
hsv_s: 0.7 # image HSV-Saturation augmentation (fraction)
hsv_v: 0.4 # image HSV-Value augmentation (fraction)
degrees: 0.0 # image rotation (+/- deg)
translate: 0.1 # image translation (+/- fraction)
scale: 0.5 # image scale (+/- gain)
shear: 0.0 # image shear (+/- deg)
perspective: 0.0 # image perspective (+/- fraction), range 0-0.001
flipud: 0.0 # image flip up-down (probability)
fliplr: 0.5 # image flip left-right (probability)
mosaic: 1.0 # image mosaic (probability)
mixup: 0.0 # image mixup (probability)
```
### 訓練
* **資料數量**:每個類別≥1.5k圖像
* **每類實例**:每類總計≥10,000個實例(帶標籤的對象)
* **圖像種類**:必須代表所部署的環境。對於現實世界中的例,建議使用一天中不同時間,不同季節,不同天氣,不同照明,不同角度,不同來源(網路圖片、本地收集、不同相機)等圖像。
* **標籤一致性**:所有圖像中所有類的所有實例都必須標記,部分標籤將不起作用。
* **標籤精度**:標籤必須緊密包圍每個對象,對象與其邊界框之間不應存在任何空間,任何物體都不應缺少標籤。
* **背景圖像**:背景圖像是沒有對象的圖像,這些圖像被添加到數據集中以減少誤報(FP),建議使用大約0-10%的背景圖片來幫助減少FP(COCO提供1000張背景圖片作為參考,佔總數的1%)。
* **Epochs**:起手300,若未過度擬和,可訓練至600,1200以上
* **Image size**:預設`--img 640`
* **Batch size**:應避免使用較小batch,否則會產生不準確的統計數據
* 使用[Google Cloud訓練](https://github.com/ultralytics/yolov5/wiki/GCP-Quickstart)
* 使用[AWS訓練](https://github.com/ultralytics/yolov5/wiki/AWS-Quickstart)
官方指令
`python train.py --img 640 --batch 16 --epochs 5 --data coco128.yaml --weights yolov5s.pt`
個人指令(workers核心、evolve視覺化超參數調校)
`python train.py --batch 16 --epochs 5 --data train.yaml --workers 0 --evolve`
繪製訓練結果
```python=
import sys
sys.path.append('.')
from yolov5.utils.plots import plot_results
plot_results(save_dir='yolov5/runs/train/exp')
```
* `hyp.yaml`
* `opt.yaml`
* `results.png`
* `test_batch*.jpg`

### 其他偵測指令
使用攝像頭(0代表webcam)
`python detect.py --source 0 --weights yolov5s.pt --conf 0.25`
使用glob批次偵測
`python detect.py --source path/*.jpg`
 Sign in with Wallet
Connect another wallet
Sign in with Wallet
Connect another wallet