# 2017q3 software-pipelining
contributed by<`changyuanhua`,`vonchuang`>
* [實驗用程式碼](https://github.com/vonchuang/prefetcher)
* [講解的錄影](https://youtu.be/djQNFbMes14)
## 目標
- [ ] 閱讀論文 "[When Prefetching Works, When It Doesn’t, and Why](http://www.cc.gatech.edu/~hyesoon/lee_taco12.pdf)",紀錄認知
* [論文重點提示和解說](https://hackmd.io/s/HJtfT3icx)
- [x] 詳細閱讀 [software pipelining](https://hackmd.io/s/S1fZ1m6pe) 共筆以及裡頭對應的==錄影==
- [x] 在 Linux/x86_64 (注意,要用 64-bit 系統,不能透過虛擬機器執行) 上編譯並執行 [prefetcher](https://github.com/sysprog21/prefetcher)
* 說明 `naive_transpose`, `sse_transpose`, `sse_prefetch_transpose` 之間的效能差異,以及 prefetcher 對 cache 的影響
- [x] 在 github 上 fork [prefetcher](https://github.com/sysprog21/prefetcher),參照下方「見賢思齊:共筆選讀」的實驗,嘗試用 AVX 進一步提昇效能。分析的方法可參見 [Matrix Multiplication using SIMD](https://hackmd.io/s/Hk-llHEyx)
* 修改 `Makefile`,產生新的執行檔,分別對應於 `naive_transpose`, `sse_transpose`, `sse_prefetch_transpose` (學習 [phonebook](s/S1RVdgza) 的做法),學習 [你所不知道的 C 語言:物件導向程式設計篇](https://hackmd.io/s/HJLyQaQMl) 提到的封裝技巧,以物件導向的方式封裝轉置矩陣的不同實作,得以透過一致的介面 (interface) 存取個別方法並且評估效能
* 用 perf 分析 cache miss/hit
* 學習 `perf stat` 的 raw counter 命令
* 參考 [Performance of SSE and AVX Instruction Sets](http://arxiv.org/pdf/1211.0820.pdf),用 SSE/AVX intrinsic 來改寫程式碼
- [ ] 將原本 8x8 矩陣推廣到更大的範圍,如 16x16, 32x32, 64x64 等等,並透過實際的實驗來驗證前述推論
## 開發環境
* 輸入指令 ` lscpu `
```
Architecture: x86_64
CPU 作業模式: 32-bit, 64-bit
Byte Order: Little Endian
CPU(s): 4
On-line CPU(s) list: 0-3
每核心執行緒數:1
每通訊端核心數:4
Socket(s): 1
NUMA 節點: 1
供應商識別號: GenuineIntel
CPU 家族: 6
型號: 94
Model name: Intel(R) Core(TM) i5-6300HQ CPU @ 2.30GHz
製程: 3
CPU MHz: 799.890
CPU max MHz: 3200.0000
CPU min MHz: 800.0000
BogoMIPS: 4608.00
虛擬: VT-x
L1d 快取: 32K
L1i 快取: 32K
L2 快取: 256K
L3 快取: 6144K
NUMA node0 CPU(s): 0-3
```
## 論文筆記
* [When Prefetching Works, When It Doesn’t, and Why](http://www.cc.gatech.edu/~hyesoon/lee_taco12.pdf)
### Cache 介紹
CPU 快取是用於減少處理器訪問記憶體所需平均時間的部件,下圖為處理器架構:
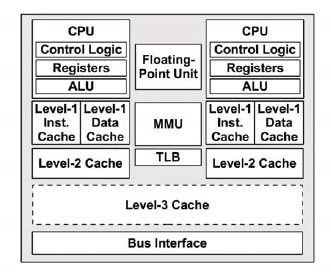
1. level-1 data cache:一級數據快取(I$)
2. level-1 inst cache:一級指令快取(D$)
3. MMU:記憶體管理單元
4. TLB:轉譯後備緩衝區 (translation lookaside buffer)
5. level-2 cache:二級緩存(E$)
6. level-3 cache:三級緩存
處理器讀取數據過程如下面兩個圖:
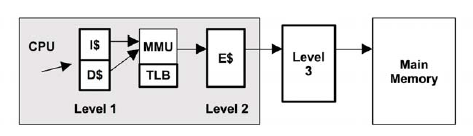
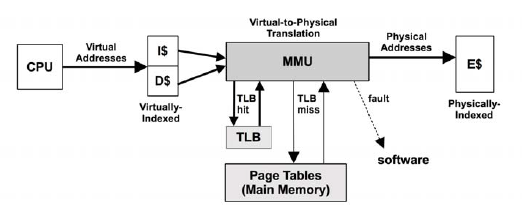
整個過程大致如下:
1. CPU 根據虛擬地址嘗試從一級快取 (存放的是虛擬地址的索引) 中讀取數據;
2. 如果一級快取中查找不到,則需向 MMU 請求數據;
3. MMU 從 TLB 中查找虛擬地址的快取 (換言之,TLB 是負責改進虛擬地址到物理地址轉換速度、存放虛擬地址的快取);
4. 如果 TLB 中存在該虛擬地址的快取,則 MMU 將該虛擬地址轉化為物理地址,如果地址轉換失敗,則發生缺頁 (圖中的 fault 分支),由內核進行處理,見上文所述;如果地址轉換成功,則從二級快取 (存放的是物理地址的索引) 中讀取;如果二級快取中也沒有,則需要從三級快取,甚至物理記憶體中請求;
5. 如果 TLB 中不存在該虛擬地址的快取,則 MMU 從物理記憶體中的轉換表 (translation tables,也稱為分頁表 page tables) 中獲取,同時存入 TLB;(注意,這個操作是硬體實現的,可以由 MMU 通過硬體直接從物理記憶體中讀取);
6. 跳到第4步。
reference:
* [perf stat 輸出解讀](http://zhengheng.me/2015/11/12/perf-stat/)
## prefetch
* prefetch 的意義
* 如果在CPU操作數據之前,我們就已經將數據提前加載到快取中,那麼就減少了由於快取未中 (cache-miss),需要從記憶體取值的情況,這樣就可以加速操作,獲得性能上提升。使用主動快取技術來優化記憶體複製。
* 值得注意的是,CPU 對數據操作擁有絕對自由!使用預取指令只是按我們自己的想法對 CPU 的數據操作進行補充,有可能CPU當前並不需要我們加載到快取的數據。這樣,我們的預取指令可能會帶來相反的結果,比如對於多工系統,有可能我們沖掉了有用的 cache。不過,在多工系統上,由於執行緒 (thread) 或行程 (process) 的切換所花費的時間相對於預取操作來說太長了, 所以可以忽略執行緒或行程切換對預取的影響。
## prefetch distance
* prefetch distance 的定義: the distance ahead of which a prefetch should be requested on a memory address.

Table I 中的 D 表示為 prefetch distance ,在 array data structure 中要預取的 cache block 的存儲器地址是通過向 array 中的 index 添加常數值D來計算的
* 計算公式:$D > \lceil \frac{l}{s} \rceil$
為了可以及時取出需要的資料,每次 prefetch 都要取出:
`當下往後D次迴圈後的資料`,這樣在需要使用時,就會有正確的資料可以使用,不然每次 prefetch 會來不及趕上或是等待過久。
* $D$:$D$ 是指 prefetch distance ,而 prefetch distance 的大小和記憶體的存取速度,以及迴圈大小有關
* $l$:$l$ 是指 prefetch latency。prefetch latency 是送出 Prefetch 的要求,到實際拿到資料需要的一段時間
* $s$:$s$ 是指 the length of the shortest path through the loop。每經過 $s$ 的時間會存取這個資料結構一次(可以想成有個迴圈正在逐一遍歷某個陣列)


* 論文中將 Prefetch 的成功與否,分類為下面這幾種:
* Timely : 時間剛好
* Late : 太晚抓這個 data 進來,失去了“預取”的目的
* Early : 太早抓這個 data 進來,結果要用到時已經被 replaced
* Redundant : 重複取
* Inccorrect: 是指載入根本用不到的 data,這些會讓 cache miss 增加,也可以說是汙染了cache
* prefetch distance 必須要大到能夠隱藏 memory latency
* prefetch distance 太小(late): prefetch request 太晚,cpu 已經開始在 cache 上存取資料
* prefetch distance 太大(early): prefetched data 可能會驅逐有用的 cache block ,並且 array 開頭的元素可能不會被預取,從而導致 coverage 更低, cache miss 更多。因此 prefetch distance 對預取程序的整體性能有很大的影響。
* Coverage: the fraction of total misses that are eliminated because of prefetching
* Coverage = Cache Misses eliminated due to Prefetching / Total Cache Misses
### prefetch distance 實驗
#### 實驗一(sse prefetch): 比較不同 prefetch distance 的執行時間以及效能
* makefile中的程式碼:
* `CFLAGS += -D`:定義巨集變數,經過編譯之後,就可以在.c檔案中使用此定義巨集來做判斷
```clike=
ifdef PFDIST
CFLAGS += -D PFDIST=${PFDIST}
endif
pfd: clean
for i in `seq 1 20`; do \
$(MAKE) PFDIST=$$i --silent; \
printf "$$i " >> time.txt ; \
echo 1 | sudo tee /proc/sys/vm/drop_caches; \
./sse_prefetch_transpose >> time.txt; \
printf "\n" >> time.txt ; \
done
```
* perf
* perf raw counter
* 在有些系統架構中,大多數的 counter 並不能被 perf list 找到,但如果你找到一個你想用的 counter ,你可以將它指定為一個 raw event (格式:rUUEE,UU == umask,EE == event),像是 r02D1 ,其中02是 mask number ,D1 是 event number
* 在 [Intel® 64 and IA-32 Architectures Developer's Manual: Vol. 3B](http://www.intel.com/content/www/us/en/architecture-and-technology/64-ia-32-architectures-software-developer-vol-3b-part-2-manual.html) 的19章,可以從自己的 CPU 型號查到對應的 mask number 及 event number
* 下面 perf 分析會使用到的 raw counter:
* r014c: LOAD_HIT_PRE.SW_PF
* r024c: LOAD_HIT_PRE.HW_PF
* r02D1 - L2 cache hit
* r10D1 - L2 cache miss
* r04D1 - L3 cache hit
* r20D1 - L3 cache miss
* prefetch distance = 1:
```
Performance counter stats for './sse_prefetch_transpose' (10 runs):
18,444,828 cache-misses # 72.142 % of all cache refs ( +- 0.75% ) (63.84%)
25,567,249 cache-references ( +- 0.92% ) (63.95%)
11,701,446 L1-dcache-load-misses # 1.55% of all L1-dcache hits ( +- 0.83% ) (64.00%)
752,839,402 L1-dcache-loads ( +- 0.33% ) (64.01%)
274,816,216 L1-dcache-stores ( +- 0.28% ) (64.01%)
99,157 L1-icache-load-misses ( +- 1.57% ) (64.01%)
2,945,452 r014c ( +- 0.62% ) (64.01%)
228,948 r024c ( +- 9.37% ) (57.95%)
1,021,408 r02D1 ( +- 1.19% ) (60.23%)
36,953 r10D1 ( +- 11.69% ) (60.11%)
19,452 r04D1 ( +- 1.94% ) (51.84%)
12,485 r20D1 ( +- 1.27% ) (51.92%)
1,737,399,572 instructions # 2.05 insn per cycle ( +- 0.65% ) (58.37%)
846,018,098 cycles ( +- 0.50% ) (64.50%)
0.278258868 seconds time elapsed ( +- 0.69% )
```
* prefetch distance = 8:
```
Performance counter stats for './sse_prefetch_transpose' (10 runs):
11,527,446 cache-misses # 63.007 % of all cache refs ( +- 1.72% ) (63.81%)
18,295,377 cache-references ( +- 1.16% ) (63.82%)
11,113,231 L1-dcache-load-misses # 1.50% of all L1-dcache hits ( +- 0.88% ) (63.82%)
742,554,997 L1-dcache-loads ( +- 0.26% ) (63.82%)
270,608,232 L1-dcache-stores ( +- 0.27% ) (63.82%)
87,176 L1-icache-load-misses ( +- 1.78% ) (63.82%)
281,856 r014c ( +- 6.19% ) (63.82%)
229,894 r024c ( +- 9.28% ) (57.97%)
2,337,387 r02D1 ( +- 3.98% ) (60.79%)
39,184 r10D1 ( +- 1.17% ) (61.47%)
25,080 r04D1 ( +- 1.87% ) (53.28%)
16,344 r20D1 ( +- 3.38% ) (52.28%)
1,776,747,824 instructions # 2.61 insn per cycle ( +- 0.54% ) (58.59%)
680,732,166 cycles ( +- 0.24% ) (64.43%)
0.221457697 seconds time elapsed ( +- 0.60% )
```
* prefetch distance = 12:
```
Performance counter stats for './sse_prefetch_transpose' (10 runs):
12,491,955 cache-misses # 65.691 % of all cache refs ( +- 2.61% ) (62.98%)
19,016,163 cache-references ( +- 1.70% ) (63.67%)
11,862,532 L1-dcache-load-misses # 1.61% of all L1-dcache hits ( +- 1.52% ) (64.06%)
738,538,500 L1-dcache-loads ( +- 0.65% ) (64.71%)
265,192,451 L1-dcache-stores ( +- 0.43% ) (64.98%)
94,878 L1-icache-load-misses ( +- 5.65% ) (65.59%)
24,852 r014c ( +- 18.40% ) (65.70%)
259,200 r024c ( +- 8.57% ) (59.46%)
3,556,343 r02D1 ( +- 3.62% ) (60.36%)
123,688 r10D1 ( +- 15.36% ) (59.04%)
92,747 r04D1 ( +- 18.39% ) (50.54%)
27,431 r20D1 ( +- 15.83% ) (50.46%)
1,760,367,789 instructions # 2.56 insn per cycle ( +- 1.15% ) (57.26%)
686,717,320 cycles ( +- 1.14% ) (63.42%)
0.240491163 seconds time elapsed ( +- 2.18% )
```
* prefetch distance = 20:
```
Performance counter stats for './sse_prefetch_transpose' (10 runs):
14,930,681 cache-misses # 56.652 % of all cache refs ( +- 1.62% ) (64.28%)
26,355,112 cache-references ( +- 1.14% ) (64.82%)
11,506,126 L1-dcache-load-misses # 1.56% of all L1-dcache hits ( +- 1.15% ) (65.17%)
739,289,911 L1-dcache-loads ( +- 0.35% ) (65.51%)
266,233,713 L1-dcache-stores ( +- 0.74% ) (66.11%)
93,123 L1-icache-load-misses ( +- 2.60% ) (66.16%)
1,267 r014c ( +- 3.60% ) (66.18%)
291,292 r024c ( +- 4.35% ) (59.49%)
193,452 r02D1 ( +- 1.55% ) (58.52%)
4,159,873 r10D1 ( +- 1.63% ) (56.99%)
3,880,438 r04D1 ( +- 1.67% ) (48.83%)
168,495 r20D1 ( +- 7.29% ) (50.23%)
1,710,449,152 instructions # 2.49 insn per cycle ( +- 0.93% ) (58.24%)
685,875,873 cycles ( +- 0.94% ) (64.40%)
0.237775681 seconds time elapsed ( +- 1.09% )
```
* [其他 prefetch distance 的 perf 結果](https://hackmd.io/s/rkWqLyu-M)
* 實驗結果:

* 結果分析:
* 實驗結果(重複執行100次的實驗結果):

* 結果分析:
* cache miss

* 結果分析:
* r10D1(L2 cache miss):

* 結果分析:
* IPC(instruction per cycle):


* 結果分析:
#### 實驗二(avx prefetch): 比較不同 prefetch distance 的執行時間以及效能
1. 實驗結果(prefetch distance 1~40):

* 結果分析:這是 prefetch distance 1~40 的時間比較圖,但因為只執行一次,只從此圖看出在大約 prefetch distance 10 以後,執行時間有逐漸上升,無法明確看出 timely , late , early ,因此接著比較 prefetch distance 1~100,以來觀察 prefetch timely 位於哪段 distance
2. 實驗結果(prefetch distance 1~100):

* 結果分析:這是 prefetch distance 1~100 的時間比較圖,在這張圖可以看到 prefetch 1~30 的執行時間較其他距離低,因此推測 prefetch timely 在此範圍中,然而無法明確看出這張圖中 timely , late , early 位於的區段,所以接著執行 prefetch distance 1~30,並重複執行100次。
3. 實驗結果(prefetch distance 1~30(100 次平均))->第一次:

|distance|time|distance|time|distance|time|
|--------|----|--------|----|--------|--------|
|1|55542.054|11| 51445.986|21| 53940.23|
|2| 55913.266|12| 51587.33|22| 53641.179|
|3| 54025.94|13| 52554.398|23| 55055.568|
|4| 54084.633|14| 52422.197|24| 54264.255|
|5|52981.885|15| 52104.55|25| 54850.852|
|6| 52725.476|16| 52381.843|26| 54749.051|
|7| **<font color="#006699">50900.602</font>**|17| 52925.904|27| 54883.265|
|8| 51283.657|18| 53391.204|28|55703.9|
|9| 51379.069|19| 53579.475|29| 55961.272|
|10| **<font color="#006699">50877.663</font>**|20| 53242.423|30| 55942.22|
* 結果分析:這是 prefetch distance 1~30 重複執行100次的時間比較圖,在這張圖可以看到 prefetch 7~10 的執行時間較其他距離低,因此推測 prefetch timely 在此範圍,prefetch 7 以前的範圍,為 prefetch late,而 prefetch 10 以後的範圍,為 prefetch early
4. 實驗結果(prefetch distance 1~30(100 次平均))->第二次:

|distance|time|distance|time|distance|time|
|--------|----|--------|----|--------|--------|
|1 |54534.382|11 |49985.784|21 |52316.857|
|2 |54182.105|12 |49759.201|22 |51906.385|
|3 |52002.398|13 |50525.176|23 |53225.511|
|4 |52318.836|14 |51049.788|24 |52741.997|
|5 |50781.044|15 |51073.010|25 |53903.179|
|6 |51153.778|16 |50807.230|26 |53713.169|
|7 |49509.160|17 |50636.573|27 |53082.176|
|8 |49670.598|18 |51116.230|28 |54087.863|
|9 |**<font color="#006699">49381.901</font>**|19 |51542.549|29 |54663.468|
|10 |49712.684|20 |51592.086|30 |53808.543|
* 結果分析:這是 prefetch distance 1~30 重複執行100次的時間比較圖,在這張圖可以確認 prefetch 7~10 的執行時間較其他距離低,應為 prefetch timely 的範圍,
* 實驗結果(prefetch distance 9 和 16(100 次平均)):

|distance|平均時間|
|--------|----|
|distance 9|49553.042|
|distance 16|50539.942|
## prefetcher
程式碼:[github](https://github.com/vonchuang/prefetcher)
### 開發環境
$ cat /etc/issue
Ubuntu 16.04.3 LTS
$ lscpu
Architecture: x86_64
CPU op-mode(s): 32-bit, 64-bit
Byte Order: Little Endian
CPU(s): 4
On-line CPU(s) list: 0-3
Thread(s) per core: 2
Core(s) per socket: 2
Socket(s): 1
NUMA node(s): 1
Vendor ID: GenuineIntel
CPU family: 6
Model: 37
Model name: Intel(R) Core(TM) i3 CPU M 350 @ 2.27GHz
Stepping: 2
CPU MHz: 1866.000
CPU max MHz: 2266.0000
CPU min MHz: 933.0000
BogoMIPS: 4522.32
Virtualization: VT-x
L1d cache: 32K
L1i cache: 32K
L2 cache: 256K
L3 cache: 3072K
NUMA node0 CPU(s): 0-3
### 修改 Makefile
#### impl.c
先將原先的`impl.c`分成`naive_transpose.c`,`sse_transpose.c`,`sse_prefetch_transpose.c`,並在各檔中定義一數值以利 main.c 判斷該使用哪種 transpose
* naive_transpose.c:`#define NAIVE 1`
* sse_transpose.c:`#define SSE 1`
* sse_prefetch_transpose.c:`#define SSE_PREFETCH 1`
#### Makefile
* 在 Makefile 中分別編譯之
naive_transpose: $(SRCS_common) naive_transpose.c
$(CC) $(CFLAGS) \
-DIMPL="\"$@.c\"" -o $@ \
$(SRCS_common)
sse_transpose: $(SRCS_common) sse_transpose.c
$(CC) $(CFLAGS) \
-DIMPL="\"$@.c\"" -o $@ \
$(SRCS_common)
sse_prefetch_transpose: $(SRCS_common) sse_prefetch_transpose.c
$(CC) $(CFLAGS) \
-DIMPL="\"$@.c\"" -o $@ \
$(SRCS_common)
其中的`-DIMPL="\"$@.c\""`為依據不同檔案將之 include 進 main.c 中
* perf
再分別對三種 transpose 以 pref 分析cache miss/hit
cache-test: $(EXEC)
perf stat --repeat 10 \
-e cache-misses,cache-references,instructions,cycles \
./naive_transpose
perf stat --repeat 10 \
-e cache-misses,cache-references,instructions,cycles \
./sse_transpose
perf stat --repeat 10 \
-e cache-misses,cache-references,instructions,cycles \
./sse_prefetch_transpose
#### main.c
以`#include IMPL`依據 Makefile 的 DIMPL 分別 include 不同的 transpose 檔,再依該檔判斷並執行不同的 transpose
```c=
#if defined(SSE_PREFETCH)
clock_gettime(CLOCK_REALTIME, &start);
sse_prefetch_transpose(src, out0, TEST_W, TEST_H);
clock_gettime(CLOCK_REALTIME, &end);
printf("sse prefetch: \t %ld us\n", diff_in_us(start, end));
#elif defined(SSE)
clock_gettime(CLOCK_REALTIME, &start);
sse_transpose(src, out1, TEST_W, TEST_H);
clock_gettime(CLOCK_REALTIME, &end);
printf("sse: \t\t %ld us\n", diff_in_us(start, end));
#elif defined(NAIVE)
clock_gettime(CLOCK_REALTIME, &start);
naive_transpose(src, out2, TEST_W, TEST_H);
clock_gettime(CLOCK_REALTIME, &end);
printf("naive: \t\t %ld us\n", diff_in_us(start, end));
#endif
```
### naive_transpose
```c==
void naive_transpose(int *src, int *dst, int w, int h)
{
for (int x = 0; x < w; x++)
for (int y = 0; y < h; y++)
*(dst + x * h + y) = *(src + y * w + x);
}
```
直接分別將代表行與列的 x , y 對調後存至 dst。假設 1 word = 4 Byte,Cache 為 4 word,而 Cache 初始為空,則
* 在 dst 的 Cache miss 為:
| dst[i][j] | j = 0 | j = 1 | j = 2 | j = 3 |
|:---------:|:-----:|:-----:|:-----:|:-----:|
| i = 0 | [m] | [h] | [h] | [h] |
| i = 1 | [m] | [h] | [h] | [h] |
| i = 2 | [m] | [h] | [h] | [h] |
| i = 3 | [m] | [h] | [h] | [h] |
在 dst[0][0] 時,會 miss,同時相應的包含 dst[0][0]~ dst[0][3] 被存到 Cache 中,因此接下來三個引用都會是 hit。i = 1 ~ i = 3 皆是如此,故其 Cache miss rate 為 1/4。
* 在 src 的 Cache miss 為:
| src[i][j] | j = 0 | j = 1 | j = 2 | j = 3 |
|:---------:|:-----:|:-----:|:-----:|:-----:|
| i = 0 | [m] | [m] | [m] | [m] |
| i = 1 | [m] | [m] | [m] | [m] |
| i = 2 | [m] | [m] | [m] | [m] |
| i = 3 | [m] | [m] | [m] | [m] |
在這裡是一列一列而不是一行一行的掃描矩陣 src。如果夠幸運的話,整個矩陣都在 Cache 中,那麼也會是 1/4 的 Cache miss rate。但若是矩陣比 Cache 要大,那麼每次對 src[i][j] 的存取都是 miss,嚴重影響程式的執行效率!
### sse_transpose
此處可用分塊(Blocking)來提升效能,即將一個程式中的數據結構組織成大的片(Chunk),稱為塊(Block)。這樣的結構程式,能夠將一個片加載到 L1 Cache 中,並在這個片中進行所有的讀和寫,然後就丟掉這個片,加仔下一個片,依此類推。此方式可以提高其 Temporal Locality,在一些沒有 Prefetch 的系統上獲得極大的性能收益。
> temporal locality(時間的局部性): 一個記憶體位址被存取後,不久會再度被存取
* [CS:APP2e Web Aside MEM:BLOCKING:Using Blocking to Increase Temporal Locality∗](http://csapp.cs.cmu.edu/2e/waside/waside-blocking.pdf)
```c==
void sse_transpose(int *src, int *dst, int w, int h)
{
for (int x = 0; x < w; x += 4) {
for (int y = 0; y < h; y += 4) {
__m128i I0 = _mm_loadu_si128((__m128i *)(src + (y + 0) * w + x));
__m128i I1 = _mm_loadu_si128((__m128i *)(src + (y + 1) * w + x));
__m128i I2 = _mm_loadu_si128((__m128i *)(src + (y + 2) * w + x));
__m128i I3 = _mm_loadu_si128((__m128i *)(src + (y + 3) * w + x));
__m128i T0 = _mm_unpacklo_epi32(I0, I1);
__m128i T1 = _mm_unpacklo_epi32(I2, I3);
__m128i T2 = _mm_unpackhi_epi32(I0, I1);
__m128i T3 = _mm_unpackhi_epi32(I2, I3);
I0 = _mm_unpacklo_epi64(T0, T1);
I1 = _mm_unpackhi_epi64(T0, T1);
I2 = _mm_unpacklo_epi64(T2, T3);
I3 = _mm_unpackhi_epi64(T2, T3);
_mm_storeu_si128((__m128i *)(dst + ((x + 0) * h) + y), I0);
_mm_storeu_si128((__m128i *)(dst + ((x + 1) * h) + y), I1);
_mm_storeu_si128((__m128i *)(dst + ((x + 2) * h) + y), I2);
_mm_storeu_si128((__m128i *)(dst + ((x + 3) * h) + y), I3);
}
}
}
```
0 1 2 3
4 5 6 7
8 9 10 11
12 13 14 15
0 1 4 5
8 9 12 13
2 3 6 7
10 11 14 15
0 1 8 9
2 3 10 11
4 5 12 13
6 7 14 15
0 1 2 3
4 5 6 7
8 9 10 11
12 13 14 15
Performance counter stats for './naive_transpose' (10 runs):
19,219,864 cache-misses # 96.869 % of all cache refs ( +- 0.03% )
19,841,159 cache-references ( +- 0.26% )
1,527,263,121 instructions # 0.73 insn per cycle ( +- 0.01% )
2,088,780,011 cycles ( +- 0.35% )
0.938373013 seconds time elapsed ( +- 1.01% )
Performance counter stats for './sse_transpose' (10 runs):
6,511,540 cache-misses # 88.634 % of all cache refs ( +- 0.02% )
7,346,541 cache-references ( +- 0.17% )
1,314,247,165 instructions # 1.06 insn per cycle ( +- 0.01% )
1,242,508,090 cycles ( +- 0.72% )
0.556691565 seconds time elapsed ( +- 0.64% )
經過實際執行測試後,確認 sse_transpose 確實比 naive_transpose 有較低的 Cache miss,執行時間降低為約 0.6 倍。
### sse_prefetch_transpose
```c=
for (int x = 0; x < w; x += 4) {
for (int y = 0; y < h; y += 4) {
#define PFDIST 8
_mm_prefetch(src+(y + PFDIST + 0) *w + x, _MM_HINT_T1);
_mm_prefetch(src+(y + PFDIST + 1) *w + x, _MM_HINT_T1);
_mm_prefetch(src+(y + PFDIST + 2) *w + x, _MM_HINT_T1);
_mm_prefetch(src+(y + PFDIST + 3) *w + x, _MM_HINT_T1);
```
將 sse_transpose 的程使稍作改良,在每次轉置前先存取資料到 Cache 中,可降低 Cache miss,減少 miss penalty,進而增進效能。
* `void _mm_prefetch(char *p, int i)`
* p : 給定預事先存取資料的位置
* i : 選擇事先存取的方式(`_MM_HINT_T0`,`_MM_HINT_T1`,`_MM_HINT_T2`,`_MM_HINT_NTA`)
* `_mm_prefetch`本質上為指令,其對應的組合語言為`PREFETCHh`—Prefetch Data Into Caches
* `PREFETCHh`只是一個 hint,CPU 並不一定會執行動作

*[圖片來源](http://www.cc.gatech.edu/~hyesoon/lee_taco12.pdf)*
* `PREFETCHh` :
| Opcode | Instruction | Op/En | 64-Bit Mode | Compat/Leg Mode | Description |
|:-------|:------------|:------|:------------|:----------------|:------------|
| 0F 18 /1 | PREFETCHT0 m8 | M | Valid | Valid | Move data from m8 closer to the processor using T0 hint |
| 0F 18 /2 | PREFETCHT1 m8 | M | Valid | Valid | Move data from m8 closer to the processor using T1 hint |
| 0F 18 /3 | PREFETCHT2 m8 | M | Valid | Valid | Move data from m8 closer to the processor using T2 hint |
| 0F 18 /0 | PREFETCHNTA m8 | M | Valid | Valid | Move data from m8 closer to the processor using NTA hint |
:::success
* T0 : 事先載入資料到所有層級的 Cache 中
* T1 : 事先載入資料到層級為 2 級及以上的 Cache 中(即,除了 L1 以外的所有 Cache)
* T2 : 事先載入資料到層級為 3 級及以上的 Cache 中(即,除了 L1 和 L2 以外的所有 Cache)
* NTA : 事先載入資料到非臨時且靠近 processor 的 Cache 中(通常是 L1 cache 或 L2 cache),可最小化對 Cache 的汙染
* [Non-temporal loads and the hardware prefetcher, do they work together?](https://stackoverflow.com/questions/32103968/non-temporal-loads-and-the-hardware-prefetcher-do-they-work-together)
> Intel's manuals imply that prefetchNTA fetches into L1D and (into one way of) L3

*[圖片來源](http://www.cc.gatech.edu/~hyesoon/lee_taco12.pdf)*
:::
#### Raw counters
`$perf list`並不會列出所有可偵測的情形,若是無法在其中找到所需,可於 [Intel® 64 and IA-32 Architectures Developer's Manual: Vol. 3B](https://www.intel.com/content/www/us/en/architecture-and-technology/64-ia-32-architectures-software-developer-vol-3b-part-2-manual.html) 中找到更多可使用的 Counter,稱之為 Raw Counter
* Raw Counter 的形式為`rUUEE`,其中 UU 為 umask,EE 為 Event。
* 根據不同的處理器,Event 跟 Umask 的值也會不同。以下為依據測試環境`Intel(R) Core(TM) i3 CPU M 350 @ 2.27GHz`所列之值:
| Event Num. | Umask Value | Event Mask Mnemonic | Description |
|:-----------|:------------|:---------------------------|:------------|
| 4CH | 01H | LOAD_HIT_PRE.SW_PF | Non-SW-prefetch load dispatches that hit fill buffer allocated for S/W prefetch. |
| D0H | 81H | MEM_UOPS_RETIRED.ALL_LOADS | All retired load uops. |
| D0H | 82H | MEM_UOPS_RETIRED.ALL_STORES | All retired store uops. |
| D0H | 01H | MEM_LOAD_UOPS_RETIRED.L1_HIT | Retired load uops with L1 cache hits as data sources. |
| D0H | 02H | MEM_LOAD_UOPS_RETIRED.L2_HIT | Retired load uops with L2 cache hits as data sources. |
| D0H | 04H | MEM_LOAD_UOPS_RETIRED.LLC_HIT | Retired load uops whose data source was LLC hit with no snoop required. |
| D0H | 08H | MEM_LOAD_UOPS_RETIRED.L1_MISS | Retired load uops whose data source followed an L1 miss. |
| D0H | 10H | MEM_LOAD_UOPS_RETIRED.L2_MISS | Retired load uops that missed L2, excluding unknown sources. |
| D0H | 20H | MEM_LOAD_UOPS_RETIRED.LLC_MISS | Retired load uops whose data source is LLC miss. |
依此實際測試給定程式不同的 Hint 時,其 Cache miss, prefetch 等情形,並比較四者的差異:
* sse-transpose:
Performance counter stats for './sse_transpose' (10 runs):
6,282,455 cache-misses # 92.612 % of all cache refs ( +- 1.93% ) (18.94%)
6,783,656 cache-references ( +- 1.74% ) (19.95%)
1,208,375,002 instructions # 1.05 insn per cycle ( +- 1.09% ) (25.19%)
1,148,164,660 cycles ( +- 1.41% ) (25.73%)
443,295,887 L1-dcache-loads ( +- 1.19% ) (26.19%)
8,620,595 L1-dcache-load-misses # 1.94% of all L1-dcache hits ( +- 1.12% ) (26.25%)
2,251,129 L1-dcache-prefetches ( +- 1.30% ) (26.11%)
4,440 L1-dcache-prefetch-misses ( +- 10.70% ) (20.91%)
4,440,890 LLC-loads ( +- 3.03% ) (20.80%)
4,448,917 LLC-load-misses # 100.18% of all LL-cache hits ( +- 3.37% ) (20.63%)
363,532 LLC-prefetches ( +- 9.30% ) (10.10%)
39,545 LLC-prefetch-misses ( +- 14.52% ) (9.91%)
19,819 r014c ( +- 4.27% ) (14.91%)
0 r82d0 (19.47%)
0 r82d0 (19.09%)
1,246,538,911 r01d0 ( +- 1.97% ) (18.89%)
0 r02d0 (18.74%)
0 r04d0 (19.25%)
0 r08d0 (19.20%)
0 r10d0 (18.90%)
0 r20d0 (18.67%)
0.559394008 seconds time elapsed ( +- 0.88% )
* sse-prefetch-transpose(T0)
Performance counter stats for './sse_prefetch_transpose' (10 runs):
6,234,747 cache-misses # 96.627 % of all cache refs ( +- 3.31% ) (19.28%)
6,452,393 cache-references ( +- 3.60% ) (19.61%)
1,350,558,124 instructions # 1.48 insn per cycle ( +- 1.19% ) (24.43%)
915,436,632 cycles ( +- 0.91% ) (24.55%)
481,342,795 L1-dcache-loads ( +- 1.21% ) (24.64%)
7,207,800 L1-dcache-load-misses # 1.50% of all L1-dcache hits ( +- 5.20% ) (24.78%)
2,330,886 L1-dcache-prefetches ( +- 4.27% ) (25.49%)
4,674 L1-dcache-prefetch-misses ( +- 7.88% ) (21.43%)
3,827,603 LLC-loads ( +- 3.84% ) (21.52%)
4,121,594 LLC-load-misses # 107.68% of all LL-cache hits ( +- 3.96% ) (21.26%)
311,904 LLC-prefetches ( +- 13.26% ) (10.40%)
26,175 LLC-prefetch-misses ( +- 9.35% ) (10.44%)
156,362 r014c ( +- 7.06% ) (15.54%)
0 r82d0 (20.50%)
0 r82d0 (20.30%)
1,222,176,158 r01d0 ( +- 0.33% ) (20.13%)
0 r02d0 (19.89%)
0 r04d0 (19.70%)
0 r08d0 (19.55%)
0 r10d0 (19.31%)
0 r20d0 (19.12%)
0.426371795 seconds time elapsed ( +- 0.76% )
* sse-prefetch-transpose(T1)
Performance counter stats for './sse_prefetch_transpose' (10 runs):
5,758,146 cache-misses # 92.114 % of all cache refs ( +- 5.01% ) (18.36%)
6,251,077 cache-references ( +- 5.67% ) (18.96%)
1,321,154,025 instructions # 1.46 insn per cycle ( +- 1.87% ) (24.30%)
905,959,322 cycles ( +- 2.14% ) (24.60%)
473,197,320 L1-dcache-loads ( +- 1.70% ) (25.14%)
7,398,959 L1-dcache-load-misses # 1.56% of all L1-dcache hits ( +- 6.23% ) (26.86%)
2,179,161 L1-dcache-prefetches ( +- 5.21% ) (26.50%)
4,441 L1-dcache-prefetch-misses ( +- 8.41% ) (21.54%)
4,239,907 LLC-loads ( +- 4.80% ) (21.23%)
4,339,259 LLC-load-misses # 102.34% of all LL-cache hits ( +- 4.73% ) (21.01%)
312,456 LLC-prefetches ( +- 11.39% ) (10.51%)
27,690 LLC-prefetch-misses ( +- 4.29% ) (10.30%)
182,223 r014c ( +- 7.21% ) (15.30%)
0 r82d0 (20.20%)
0 r82d0 (19.99%)
1,235,676,607 r01d0 ( +- 1.17% ) (20.13%)
0 r02d0 (19.93%)
0 r04d0 (19.69%)
0 r08d0 (19.43%)
0 r10d0 (19.08%)
0 r20d0 (18.57%)
0.422474481 seconds time elapsed ( +- 1.19% )
* sse-prefetch-transpose(T2)
Performance counter stats for './sse_prefetch_transpose' (10 runs):
6,049,351 cache-misses # 96.873 % of all cache refs ( +- 2.96% ) (19.18%)
6,244,603 cache-references ( +- 2.31% ) (19.56%)
1,347,072,434 instructions # 1.43 insn per cycle ( +- 0.66% ) (24.33%)
943,767,484 cycles ( +- 3.60% ) (24.36%)
474,619,500 L1-dcache-loads ( +- 1.43% ) (24.76%)
6,865,977 L1-dcache-load-misses # 1.45% of all L1-dcache hits ( +- 2.02% ) (24.45%)
2,481,744 L1-dcache-prefetches ( +- 2.70% ) (24.33%)
4,206 L1-dcache-prefetch-misses ( +- 2.88% ) (21.08%)
3,972,475 LLC-loads ( +- 3.35% ) (21.52%)
4,357,785 LLC-load-misses # 109.70% of all LL-cache hits ( +- 1.96% ) (21.28%)
498,598 LLC-prefetches ( +- 11.46% ) (10.53%)
31,366 LLC-prefetch-misses ( +- 2.81% ) (10.45%)
188,798 r014c ( +- 1.89% ) (15.49%)
0 r82d0 (20.46%)
0 r82d0 (20.27%)
1,236,227,193 r01d0 ( +- 0.60% ) (20.04%)
0 r02d0 (19.87%)
0 r04d0 (19.69%)
0 r08d0 (19.48%)
0 r10d0 (19.29%)
0 r20d0 (19.04%)
0.440200280 seconds time elapsed ( +- 3.55% )
* sse-prefetch-transpose(NTA)
Performance counter stats for './sse_prefetch_transpose' (10 runs):
5,921,357 cache-misses # 89.033 % of all cache refs ( +- 4.62% ) (18.30%)
6,650,740 cache-references ( +- 7.27% ) (19.05%)
1,287,992,474 instructions # 1.40 insn per cycle ( +- 2.35% ) (24.54%)
917,113,958 cycles ( +- 4.18% ) (24.97%)
461,517,367 L1-dcache-loads ( +- 2.29% ) (25.92%)
7,674,133 L1-dcache-load-misses # 1.66% of all L1-dcache hits ( +- 9.60% ) (26.84%)
2,281,064 L1-dcache-prefetches ( +- 4.77% ) (26.82%)
7,122 L1-dcache-prefetch-misses ( +- 10.88% ) (21.03%)
4,468,090 LLC-loads ( +- 7.10% ) (20.90%)
4,254,908 LLC-load-misses # 95.23% of all LL-cache hits ( +- 5.98% ) (20.54%)
467,020 LLC-prefetches ( +- 8.57% ) (10.21%)
148,930 LLC-prefetch-misses ( +- 24.88% ) (10.47%)
245,885 r014c ( +- 19.58% ) (15.52%)
0 r82d0 (20.49%)
0 r82d0 (20.28%)
1,205,895,629 r01d0 ( +- 1.31% ) (20.07%)
0 r02d0 (19.89%)
0 r04d0 (19.66%)
0 r08d0 (19.34%)
0 r10d0 (18.95%)
0 r20d0 (18.43%)
0.432545105 seconds time elapsed ( +- 2.64% )
#### 比較
| HINT | no-prefetch | T0 | T1 | T2 | NTA |
|:-----|:---|:---|:---|:----|:-----|
| cache-misses | 6,282,455 | 6,234,747 | 5,758,146 | 6,049,351 | 5,921,357 |
| cache-references | 6,783,656 | 6,452,393 | 6,251,077 | 6,049,351 | 6,650,740 |
| instructions | 1,208,375,002 | 1,350,558,124 | 1,321,154,025 | 1,347,072,434 | 1,287,992,474 |
| cycles | 1,148,164,660 | 915,436,632 | 905,959,322 | 943,767,484 | 917,113,958 |
| L1-dcache-loads | 443,295,887 | 481,342,795 | 473,197,320 | 474,619,500 | 461,517,367 |
| L1-dcache-load-misses | 8,620,595 | 7,207,800 | 7,398,959 | 6,865,977 | 7,674,133 |
| L1-dcache-prefetches | 2,251,129 | 2,330,886 | 2,179,161 | 2,481,744 | 2,281,064 |
| L1-dcache-prefetch-misses | 4,440 | 4,674 | 4,441 | 4,206 | 7,122 |
| LLC-loads | 4,440,890 | 3,827,603 | 4,239,907 | 3,972,475 | 4,468,090 |
| LLC-load-misses | 4,448,917 | 4,121,594 | 4,339,259 | 4,357,785 | 4,254,908 |
| LLC-prefetches | 363,532 | 311,904 | 312,456 | 498,598 | 467,020 |
| LLC-prefetch-misses | 39,545 | 26,175 | 27,690 | 31,366 | 148,930 |
| r014c | 19,819 | 156,362 | 182,223 | 188,798 | 245,885 |
| r82d0 | 0 | 0 | 0 | 0 | 0 |
| r01d0 | 0 | 0 | 0 | 0 | 0 |
| r02d0 | 1,246,538,911 | 1,222,176,158 | 1,235,676,607 | 1,236,227,193 | 1,205,895,629 |
| r04d0 | 0 | 0 | 0 | 0 | 0 |
| r08d0 | 0 | 0 | 0 | 0 | 0 |
| r10d0 | 0 | 0 | 0 | 0 | 0 |
| r20d0 | 0 | 0 | 0 | 0 | 0 |
* 由上表可觀察到,有 Prefetch 的 L1-dcache-loads-misses 普遍較低,並且每個周期耗時較短、執行的指令較多,可見其效能確實有提升。
* 其中 L1-dcache-prefetches, L1-dcache-prefetch-misses, LLC-prefetches, LLC-prefetch-misses 皆為 HW-Prefetch,非此篇重點,故不深究其數據。
* 測試 SW-Prefetch 的為 r014c,由此可見有 Prefetch 與無 Prefetch 間相差近十倍,尤其是 NTA,約為12倍。
* 若是看 instructions 及執行時間,為 T0 較好,符合中[When Prefetching Works, When It Doesn’t, and Why](http://www.cc.gatech.edu/~hyesoon/lee_taco12.pdf)所述
> Where we might expect the T1 and T2 hints to work well is in the case of streaming applications that have little data reuse. Since our benchmarks do not have such applications, we find that T0 always performs better than other hints in all evaluated benchmarks.
* [Haskell Compilation Improvement](https://www.realworldtech.com/forum/?threadid=132668&curpostid=132772)
#### 參考
* [PREFETCHh—Prefetch Data Into Caches](http://www.felixcloutier.com/x86/PREFETCHh.html)
* [What are _mm_prefetch() locality hints?](https://stackoverflow.com/questions/46521694/what-are-mm-prefetch-locality-hints)
* [The Intel Intrinsics Guide](https://software.intel.com/sites/landingpage/IntrinsicsGuide/#)
* [SSE 介紹 [Page 7]](https://www.csie.ntu.edu.tw/~r89004/hive/sse/page_7.html)
* [Units of perf stat statistics](https://stackoverflow.com/questions/23023193/units-of-perf-stat-statistics)
* [perf stat 输出解读](https://zhengheng.me/2015/11/12/perf-stat/)
* [perf Examples](http://www.brendangregg.com/perf.html#CPUstatistics)
* [How to monitor the full range of CPU performance events](http://www.bnikolic.co.uk/blog/hpc-prof-events.html)
### 改變矩陣大小
改變 main.c 裡的設定,即可改變輸入矩陣的大小
- [ ] 待補:實驗及分析
#### 8 x 8
#### 16 x 16
#### 32 x 32
#### 64 x 64