# Tan Ching Joe's log
[Markdown guide](https://www.markdownguide.org/)
https://news.mit.edu/2012/mit-harvard-edx-announcement-050212
## meeting 12 May 2021 14:00
- Finding out the suitable MOOC datasets
https://www.kaggle.com/search
- Unsupervised learning vs supervised learning
Unsupervised learning is a machine learning approach in which the model does not require supervision. Instead, you should let the model figure out what it needs to know on its own. It is mostly concerned with unlabeled data.
In supervised learning, we use well-labeled data to train the machine. It indicates that some information has previously been tagged with the correct response. It is comparable to learning that occurs in the presence of a supervisor or teacher.
Example of unsupervised learning are clustering and association, while supervised learning such as regression and classification
https://www.guru99.com/supervised-vs-unsupervised-learning.html#7
- Types of clustering methods
Clustering is an unsupervised task in machine learning terms.There are two main catagories of clustering methods which is hierarchical clustering and non-hierarchical clustering.
When opposed to K-Means clustering, hierarchical clustering has a significant benefit. And far smaller datasets will benefit from this clustering process. We can group not only observations but also variables using hierarchical clustering. Hierarchical clustering uses agglomerative approaches including single linkage-similarity of their most similar observations, complete linkage-similarity of their most dissimilar observations, and average linkage- average distance between observations. In this method, we find out the number of cluster by ploting the dendrogram.
https://towardsdatascience.com/4-useful-clustering-methods-you-should-know-in-2021-ac61301e968e
On far larger datasets, non hierarchical clustering performs admirably. We can group only observations using this methods. Non-hierarchical clustering is exemplified by K-means clustering. With K means methods, we first find out the centriod and get the number of cluster by elbow methods
https://medium.com/mlearning-ai/k-means-clustering-with-scikit-learn-e2af706450e4
- Learn clustering using python
https://developer.ibm.com/technologies/data-science/tutorials/learn-clustering-algorithms-using-python-and-scikit-learn
## meeting 19 May 2021 14:00
- Doing brief analysis for MOOC data
QNA Type based
- Comparing different clustering algorithms
https://scikit-learn.org/stable/auto_examples/cluster/plot_cluster_comparison.html
- Exploratory data analysis (types of graphs)
https://gohyk.bitbucket.io/UECM1703/eda/
## Meeting 28 May 2021 14:00
- Making adjustment for analysis of MOOC data in jupyter notebook
- Making powerpoint about analysis of MOOC data
Comparing the most important factor which affecting the completion rate
Making decision on type of clustering and number of cluster
- DBSCAN
Using Density Clustering is a term used to describe unsupervised learning approaches for identifying unique groups/clusters in data. It is based on the idea that a cluster in data space is a contiguous region of high point density that is separated from other clusters by contiguous regions of low point density.
It can find clusters of various forms and sizes in a vast amount of data that is noisy and contains outliers.
https://www.kdnuggets.com/2020/04/dbscan-clustering-algorithm-machine-learning.html
DBSCAN- explained
https://towardsdatascience.com/dbscan-clustering-explained-97556a2ad556
## Meeting 11 Jun 2021 1430
- Analyse another datasets (MOOC Data 2)
https://www.tutorialspoint.com/machine_learning_with_python/clustering_algorithms_k_means_algorithm.htm
Distance Metrics
Machine learning algorithms, both supervised and unsupervised, use distance metrics to understand patterns in the input data. This statistic is also used to determine whether or not two outcomes are similar. A strong distance measure can significantly increase the performance of a Clustering or Classification algorithm.Distance metrics should ideally employ a distance function that informs us the mathematically determined distance between distinct components in the data collection. The closer they are, the more alike they are, and vice versa. These distance measures are used in both supervised and unsupervised learning to assess the similarity between data points.
Minkowski Distance
Distance between p and q is

The generalized distance metric is the Minkowski distance. The term "generalized" refers to the fact that the above formula can be used to compute the distance between two data points in a variety of ways.
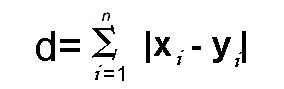
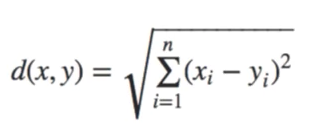
As previously stated, the value of p can be changed to calculate the distance in three distinct ways: p = 1, Manhattan Distance, p = 2, Euclidean Distance, and p = Chebychev Distance.
eg. We want to find how similar or disimilarity between 2 students favourity in watching types of movie. So we just plot down the points in 2-D plane. Then we calculate the distance to know the answer.
If we need to determine the distance between two data points on a grid-like manner, we utilize Manhattan Distance. (used when euclidean distance cannot take in account)
Euclidean distance is the most commonly used distance metric. (only for 2-dimension)
Hamming distances
Hamming Distance tests the similarity between two length lines of equal length.It is define for characters. (Only compare similar length)
It includes counting which set of numbers or places are different and which are the same. (0- similar or 1-difference )

Cosine distance
Cosine similarity is cos{$\theta}
Cosine differences is 1- cos{\theta}
angle between 2 vectors when 2 vectors are drawn from two points in the plane.
- Kmeans, Hierarchical and DBSCAN algorithms understanding
-How Hierarchical Clustering works
Hierarchical clustering can be devide into 2 techniques which is Agglomerative and divisive.
Divisive Hierarchical Clustering (Top down approach)
However, Divisive hierarchical clustering is apposite of agglomenrative and does not use much in real life.
Consider all the data points as a single cluster in Divisive Hierarchical Clustering, and separate the data points from the cluster that are not similar in each iteration. Each data point that has been isolated is termed a separate cluster. We'll be left with n clusters at the end. Divisive Hierarchical Clustering is named for the fact that it divides single clusters into n clusters.
Agglomerative Hierarchical clustering (bottom up approach)
Initially, each data point is treated as a separate cluster in this method. Similar clusters merge with other clusters in each iteration until one cluster or K clusters are produced.
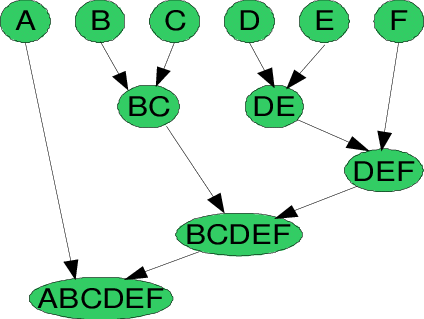
Example : let say that we have 6 data points {A,B,C,D,E,F}
In the initial steps, assume each data point is different and consider each data point as a single cluster. Then, similar cluster will merge together formed another cluster. If now assuming BC are in similar cluster, then both data points will merge in one cluster as well as DE.
After that, we again calculate the distance of new cluster and merge similar cluster together which are A, BC,and DEF. Calculate the distance between the new clusters. DEF and BC clusters are similar and have been combined to generate a new cluster. We're down to two clusters now: A and BCDEF. Lastly, all clusters will merged together.
We can visualized this pattern with a Dendrogram.
https://towardsdatascience.com/importance-of-distance-metrics-in-machine-learning-modelling-e51395ffe60d
++How do we calculate similarity between cluster++
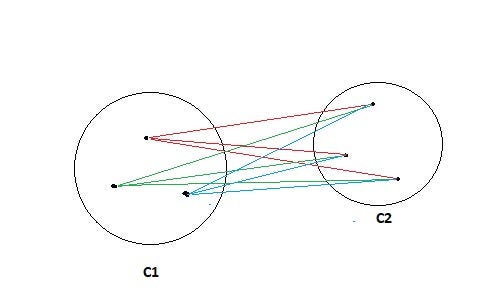
Single linkage clusters looks at all the pairwise distances between the items in the two clusters and takes the distance between the clusters as the minimum distance.( closes distance between 1 pt of 1 cluster to another pt in another cluster)
Sim(C1,C2) = Min Sim(Pi,Pj) such that Pi ∈ C1 & Pj ∈ C2
Complete linkage, which is more popular, takes the maximum distance.( want all point in the cluster to reasonably close to each other)
Sim(C1,C2) = Max Sim(Pi,Pj) such that Pi ∈ C1 & Pj ∈ C2
Average linkage takes the average, which as it turns out is fairly similar to complete linkage.
sim(C1,C2) = ∑ sim(Pi, Pj)/|C1|*|C2 where, Pi ∈ C1 & Pj ∈ C2
Centroid linkage sounds the same as average linkage but instead of using the average distance, it creates a new item which is the average of all the individual items and then uses the distance between averages. (centriod of each cluster is the mean of the items)
Ward methods ( similar objective function as kmeans) - minimum variance similar to ANOVA which to reduce SSE
This approach of calculating the similarity between two clusters is exactly the same as Group Average except that Ward’s method calculates the sum of the square of the distances Pi and PJ.
sim(C1,C2) = ∑ (dist(Pi, Pj))²/|C1|*|C2|
At each step, the process makes a new cluster that minimizes variance, measured by an index called E (also called the sum of squares index).
At each step, the following calculations are made to find E:
1. Find the mean of each cluster.(centriod)
2. Calculate the distance between each object in a particular cluster, and that cluster’s mean.
3. Square the differences from Step 2.
4. Sum (add up) the squared values from Step 3. (sum of square of deviation)
5. Add up all the sums of squares from Step 4.
smallest variance is choose as smallest deviation means smallest error.
Disadvantage- Time consuming, include mathematical calculation and complexity.
https://towardsdatascience.com/understanding-the-concept-of-hierarchical-clustering-technique-c6e8243758ec
++K-Means Clustering algorithms++ (minimize SSE within cluster square error)
The goal of k-Means clustering is to group the training points we have.One of k-Means' apparent advantages is that it calculates the feature's average value across the cluster, not simply within the cluster.
The basic assumptions of K-Means are frequently challenged as being overly naive for a large number of datasets/problems. Examples of Kmeans will be terminated.
1. For a fixed number of iterations.
This condition limits the runtime of the clustering algorithm, but in some cases the quality of the clustering will be poor because of an insufficient number of iterations.
2. Assignment of observations to clusters does not change between iterations. Except for cases with a bad local minimum.
Except for cases with a bad local minimum, this produces a good clustering, but runtimes may be unacceptably long.
3. Centroids do not change between successive iterations.
This also ensures that the algorithm has converged at the minima.
4. Terminate when SSE falls below a threshold.
Terminate when SSE falls below a threshold. This criterion ensures that the clustering is of a desired quality after termination.
How it works
Generate K random centroids as a starting point. Make a list of K random points to use as starting points. Look at which centroid is closest to each data point. Assign the data point to the centroid that is closest to it. Adjust the centroid to the average of the points that have been assigned to it. Repeat till the centroid assignment stays the same. When there are no further modifications, the algorithm is said to have "converged."
https://towardsdatascience.com/understanding-k-means-clustering-in-machine-learning-6a6e67336aa1
Inertia: It is the sum of squared distances (sse) of samples to their closest cluster center.
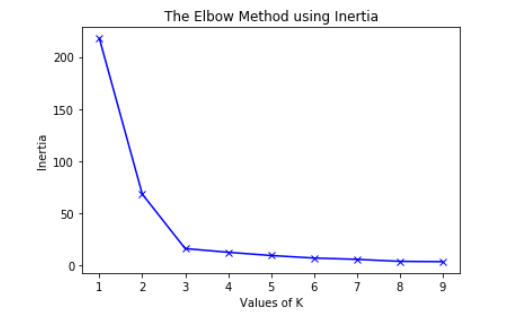
To find the optimal number of clusters, we must find the value of k at the "elbow," that is, the point at which the inertia begins to decrease linearly.
https://www.geeksforgeeks.org/elbow-method-for-optimal-value-of-k-in-kmeans/
++DBSCAN++
Based on a distance measurement (typically Euclidean distance) and a minimal number of points, DBSCAN clusters together points that are close to each other. It also identifies points in low-density areas as outliers.
eps: **radius
defines how close points must be to one another in order to be deemed a cluster. It signifies that two points are considered neighbors if their distance is less than or equal to this amount (eps).
min_sample:
The minimal number of points required to make a dense zone is minPoints.
If a point has more than a defined number of minPoints within an eps radius surrounding it, it is called a core point.Core Point belongs in a dense area at all times.
A point is considered a border point if it has fewer than MinPts within Eps but is close to a core point.
Noise point is consider as an outlier
Cons : Time and space complexity
https://shritam.medium.com/how-dbscan-algorithm-works-2b5bef80fb3
How DBSCAN works
Algorithms begin by randomly selecting a point from a dataset and assigning it to a cluster 1. The algorithm then counts how many points are within the distance from x. If this quantity is more than or equal to minPoints (n), it will be considered a core point, and all of these -neighbors will be pulled into the same cluster 1.It will next look at each member of cluster 1 to see who their -neighbors are. If a member of cluster 1 has n or more -neighbors, the cluster will be expanded by adding those -neighbors. Cluster 1 will continue to grow until there are no more examples to add.
In the latter situation, it will select a point from the dataset that does not belong to any of the clusters and assign it to cluster 2. This will continue until all cases are assigned to a cluster or labeled as outliers.
https://www.mygreatlearning.com/blog/dbscan-algorithm/
Determine the optimal eps value
K-Nearest Neighbors Algorithm
The KNN algorithm believes that objects that are similar are close together. To put it another way, related items are close together.
KNN combines the concept of similarity (also known as distance, proximity, or closeness) with some basic mathematics, such as computing the distance between points on a graph.
K=1 we use nearest neighbor to define category
if k>1, we count hw many pts is more in that category and pick that category which gets the most votes
https://towardsdatascience.com/machine-learning-basics-with-the-k-nearest-neighbors-algorithm-6a6e71d01761
## 17 Jun 2021 900 am
Why do we need to normalize the data?
Normalisation is normally applied to the algorithm
involved distance measures such as clustering.
The distance measures are affected by the scale of the
variables.
For machine learning, every dataset does not require normalization. It is required only when features have different ranges.
- The Silhouette coefficient (SC) and the Rand index are introduced as metrics for evaluating clustering results.
++Rand Index++ (-1 to +1 bad to good)
By collecting all points found within the same cluster, RI estimates a similarity between two cluster outcomes. When points are randomly assigned to clusters, its number is 0; when the two cluster outputs are the identical, it is 1. This metric is used to see if the results of dimension-reduced similarity clusters are similar.
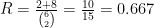
Say we have a set of six elements: {a, b, c, d, e, f}. Clustering method 1 (CM1) forms three clusters; the first two items are in group 1, the third and fourth are in group 2, and the fifth and sixth are in group 3: {1, 1, 2, 2, 3, 3}. Clustering method 2 (CM2) forms two clusters; the first three items are in group 1 and the last three items are in group 2: {1, 1, 1, 2, 2, 2}. What’s the Rand index of these two clustering results?
To manually calculate the Rand index, we need to go through every unordered pair to work out a and b ; let’s work out a first. There are 15 unordered pairs in a set of six elements: {a, b}, {a, c}, {a, d}, {a, e}, {a, f}, {b, c}, {b, d}, {b, e}, {b, f}, {c, d}, {c, e}, {c, f}, {d, e}, {d, f}, and {e, f}. a is every time a pair of elements is grouped together by the two clustering methods. {a, b} and {e, f} are clustered together by CM1 and CM2, so a = 2. b is every time a pair of elements is not grouped together by the two clustering methods. {a, d}, {a, e}, {a, f}, {b, d}, {b, e}, {b, f}, {c, e}, and {c, f} are not clustered together by CM1 and CM2, so b = 8. a and b are the times that both clustering methods agree. Therefore, the Rand index is:
https://davetang.org/muse/2017/09/21/the-rand-index/
++ Silhouette Score ++ (-1 to +1 bad to good)
The SC is used to determine whether or not points are well clustered and separated. Every sample's average nearest cluster distance is represented by "b," and the mean cluster centroid distance is represented by "a."
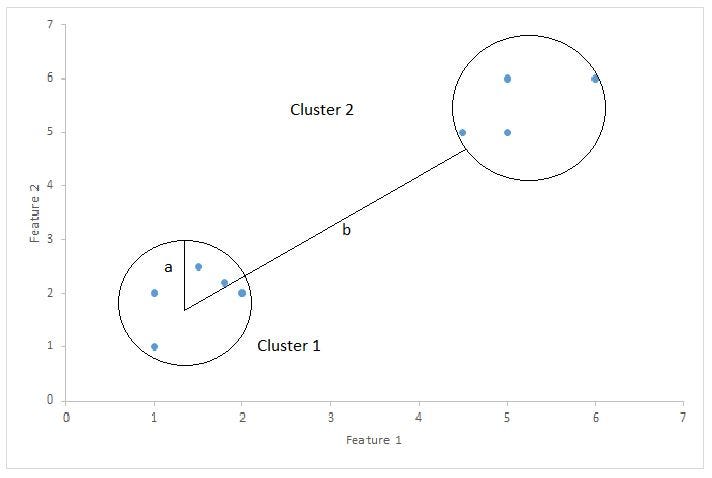
Silhouette Score = (b-a)/max(a,b)
where a= average intra-cluster distance i.e the average distance between each point within a cluster.
b= average inter-cluster distance i.e the average distance between all clusters. (take min of average- how close data pt in 1 cluster to another)
- a should always small and b is always large
https://towardsdatascience.com/silhouette-coefficient-validating-clustering-techniques-e976bb81d10c
https://www.sciencedirect.com/topics/computer-science/adjusted-rand-index
## 24 Jun 2021 900am
-Figuring problem statement
## 1 Jul 2021 900am
++ One Hot Encoding ++
One hot encoding is the conversion of categorical data variables into variables that machine learning algorithms can use to improve predictions. One hot encoding is an important aspect of machine learning feature engineering. Any inputs or outputs variables in most machine learning algorithms must be a number or numeric in value. As a result, any categorical data must be mapped to integers.With one-hot, each category value is converted into a new categorical column and given a binary value of 1 or 0. A binary vector is used to represent each integer value.Our training data is more usable and expressive as a result of one hot encoding, and it can be rescaled easily. For our output values, we choose one hot encoding in particular because it delivers more complex predictions than single labels.
https://www.educative.io/blog/one-hot-encoding
++Heatmap++
A heatmap is a two-dimensional color-based visual representation of data, where each color represents a different value.Heatmaps are a useful visual assistance for viewers, allowing for the rapid distribution of statistical or data-driven material.Heatmaps, on the other hand, present just selective information, which might obscure the big picture of an issue; heatmaps are also frequently created when only preliminary data is available.Consumers may find heatmaps to be more user-friendly. Because they are more visually accessible than standard data formats, they benefit consumers who are not accustomed to reading vast amounts of data. Heatmaps, on the other hand, can be deceiving. They can demonstrate that certain events occurred, but they don't tell you why they happened or provide insights
## 8 Jul 2021 900am
-normalization of data
-clustermap literature review
-trying to run with the clustermap
## 15 Jul 2021 900am
-Binary data conversion
-small data set clustermap
-Merging Clustermap literature review
-distance extraction
## 22 Jul 2021 900am
 Sign in with Wallet
Connect another wallet
Sign in with Wallet
Connect another wallet