# Forest Measurements
McGraw-Hill Series in Forest Resources
## Chapter 1: Introduction
* Definition of Forest Measurements: Measuring forest areas, tree growth, and related characteristics.
* Importance: Applications in forest management, conservation, and environmental monitoring.
* Historical Development: Evolution from manual methods to modern technological applications.
#### 1-1 Purpose of Book
* Objective: To provide comprehensive guidelines on forest measurement techniques and their applications.
* Audience: Primarily forest managers, students, and researchers.
* Scope: Covers traditional and modern measurement methods, statistical analysis, and practical applications.
#### 1-2 Need for Measurements
* Resource Management: Essential for sustainable management and conservation.
* Policy Making: Provides data for informed decision-making and policy formulation.
* Economic Evaluation: Helps in assessing the economic value of forest resources.
#### 1-3 Measurement Cost Considerations
* Direct Costs: Includes labor, equipment, and transportation.
* Indirect Costs: Data processing, analysis, and reporting.
* Cost-Benefit Analysis: Balancing accuracy with cost efficiency.
#### 1-4 Abbreviations and Symbols
Includes standard symbols used in measurements and their meanings, such as:
m^3: for cubic meters
ha: for hectares
| Abbreviations or Symbols | meaning |
| -------- | -------- |
|B, b| cross-sectional areas of logs of bolts|
|BA, ba| basal area|
|BAF| basal-area factor (point sampling)|
|bd ft| board feet|
|cd| cord|
|CFI|continuous forest inventory|
|cu ft| cubic feet|
|D, d | Tree or log diameter (at any specified point)|
|dbh | diameter bresast height |
|dib | diameter inside bark |
|dob | diameter outside bark |
|f | freqeuncy (statistical notation) |
|GIS | geographic information system |
|GPS | golbal positioning system |
|H, h | height |
|L, l | log or bolt length |
| M|thousand |
|MBF | thousnad board feet |
| N,n |number of (statistical notation)|
|RF|representivative fraction|
|sp gr|specific gravity|
|V,v |volume|
#### 1-5 Scales of Measurement
* Nominal Scale: Categorizes data without a quantitative value (e.g., tree species).
* Ordinal Scale: Ranks data with a meaningful order but no consistent difference between ranks (e.g., tree quality grades).
* Interval Scale: Quantitative data with consistent intervals but no true zero (e.g., temperature).
* Ratio Scale: Quantitative data with a true zero, allowing for comparisons of absolute magnitudes (e.g., tree height, volume).
#### 1-6 Significant Digits and Rounding Off
* Significant Digits: Reflects the precision of a measurement. Only meaningful digits are reported.
* Rounding Rules: Procedures to reduce the number of digits while maintaining accuracy. Typically round to the nearest significant digit based on the measurement precision.
* Example: If a tree height is measured as 35.678 meters, it might be rounded to 35.68 meters if the precision allows.
#### 1-7 English versus Metric System
* English System: Uses units such as feet, inches, and pounds. Common in the United States.
* Metric System: Uses units such as meters, centimeters, and kilograms. Standard in most other countries.
* Conversion: Important for consistency and accuracy in international studies. (e.g., 1 inch = 2.54 cm).
|converting English units to metric system||
| -------- |-------|
|1 in. or 1000 mils | 2.5400 cm|
|1 ft or 12 in.| 30.4800 cm|
|1 yd or 3 ft| 0.9144 m|
|1 U.S statute mile or 5280 ft |1.6093 km|
|1 acre or 43,560 sq ft| 0.4047 ha|
|1 cu ft or 1,728 cu in. |0.283 m^3|
|converting English units to English system||
| -------- |-------|
|1 cm or 10 mm | 0.3937 in.|
|1 dm or 10 cm | 3.9370 in.|
|1 m or 10 dm| 39.3700 in. |
|1 km or 1000 m |0.6214 US statue mile|
|1 ha or 10,000 m^2 | 2.4710 acres|
|1 m^3 or 1,000,000 cm^3 |35.3147 cu ft|
#### 1-8 Presentation of Graphs
* Types of Graphs: Bar charts, histograms, line graphs, scatter plots.
* Best Practices: Clear titles, labeled axes, appropriate scales, and legends. Ensure readability and accuracy.
* Use of Color and Symbols: Enhance clarity but maintain simplicity for better understanding.
#### 1-9 Reviews of Technical Literature
* Purpose: Summarize and evaluate existing research to provide context for new studies.
* Methodology: Systematic search, selection of relevant literature, and critical analysis.
* Presentation: Organize by themes, methods, or chronologically. Highlight key findings, gaps, and implications for future research.
#### 1-10 Presentation of Technical Reports
* Structure: Includes abstract, introduction, methods, results, discussion, and conclusion.
* Writing Style: Clear, concise, and objective. Use technical language appropriately.
* Visual Aids: Incorporate graphs, tables, and charts to support text and present data effectively.
> *2024/7/14*
## Chapter 2: Statistical Methods
* Basic Statistics: Mean, median, mode, standard deviation.
* Statistical Analysis: Regression analysis, hypothesis testing.
* Application in Forest Measurements: Data analysis and interpretation.
#### 2-1 Introduction
* Overview: Discusses the importance of statistical methods in forest measurements.
* Objective: To provide tools for data analysis and interpretation in forestry studies.
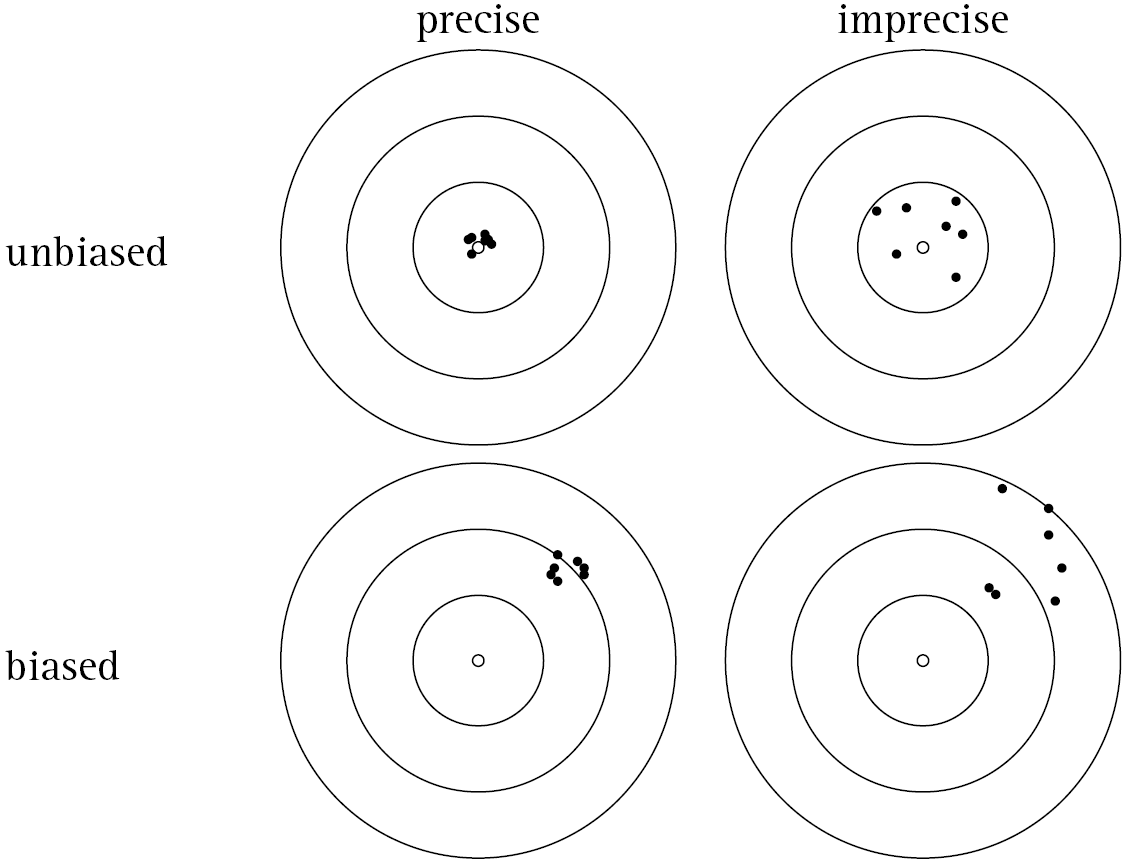
#### 2-2 Bias, Accuracy, and Precision
* Bias: Systematic error leading to incorrect results.
* Accuracy: Closeness of measurements to the true value.
* Precision: Consistency of repeated measurements.
#### 2-3 Calculating Probabilities
* Basic Concepts: Definitions of probability, events, and outcomes.
* Probability Rules: Addition and multiplication rules.
#### 2-4 Factorial Notation, Permutations, and Combinations
* Factorials: n! notation and calculations.
* Permutations: Arrangements of objects where order matters.
* Combinations: Selections of objects where order does not matter.
#### 2-5 Analysis of Data
* Steps: Data collection, organization, summarization, and interpretation.
* Tools: Graphs, tables, and statistical software.
#### 2-6 Population, Parameters, and Variables
* Population: Entire group of interest.
* Parameters: Characteristics of the population.
* Variables: Measurable attributes.
#### 2-7 Frequency Distributions
* Definition: Distribution of data values.
* Types: Histograms and frequency tables.
#### 2-8 Mode, Median, and Mean
* Mode: Most frequent value.
* Median: Middle value when data is ordered.
* Mean: Arithmetic average of data.
#### 2-9 The Range and Average Deviation
* Range: Difference between the maximum and minimum values.
* Average Deviation: Mean of absolute deviations from the mean.
#### 2-10 Variance and Standard Deviation
* Variance: Average squared deviation from the mean.
* Standard Deviation: Square root of the variance.
#### 2-11 Coefficient of Variation
* Definition: Ratio of the standard deviation to the mean.
* Purpose: Measures relative variability.
#### 2-12 Standard Error of the Mean
* Definition: Standard deviation of the sample mean distribution.
* Importance: Indicates precision of the sample mean.
#### 2-13 Confidence Limits
* Definition: Range within which a population parameter is estimated to lie.
* Calculation: Based on the standard error and confidence level.
#### 2-14 Covariance
* Definition: Measure of how two variables change together.
* Calculation: Mean of the product of deviations from the mean.
#### 2-15 Simple Correlation Coefficient
* Definition: Measure of the strength and direction of the linear relationship between two variables.
* Range: -1 to 1.
#### 2-16 Expansion of Means and Standard Errors
* Concept: Methods to calculate means and standard errors for combined data sets.
* Application: Useful in stratified sampling and other complex designs.
#### 2-17 Mean and Variance of Linear Functions
* Linear Functions: Functions that form a straight line when graphed.
* Calculations: Methods for finding the mean and variance of these functions.
#### 2-18 Definitions
* 
#### 2-19 A Linear Equation
Equation Form:
𝑦 = 𝑚𝑥 + 𝑏
where
𝑦 is the dependent variable,
𝑥 is the independent variable,
𝑚 is the slope, and
𝑏 is the intercept.
Interpretation: Understanding the relationship between variables and predicting values.
#### 2-20 A Sample Problem
* Example Calculation: Detailed walkthrough of solving a statistical problem using a linear equation.
* Steps: Identifying variables, applying the equation, and interpreting the results.
#### 2-21 Indicators of Fit
* R-Squared: Measures the proportion of variance explained by the model.
* Residual Analysis: Evaluates the differences between observed and predicted values to assess model fit.
* Adjusted R-Squared: Adjusted for the number of predictors in the model, providing a more accurate measure.
#### 2-22 Regression Through the Origin
Model Form:
𝑦 = 𝑚𝑥
, where the line passes through the origin (0,0).
* Application: Situations where the intercept is theoretically zero.
* Interpretation: Analyzing how well the model fits the data without an intercept.
#### 2-23 Hazards of Interpretation
* Overfitting: Creating a model that is too complex and fits the noise in the data rather than the underlying trend.
* Multicollinearity: When independent variables are highly correlated, leading to unreliable coefficient estimates.
* Extrapolation: Making predictions outside the range of observed data, which can be inaccurate.
#### 2-24 Multiple Regression
Model Form:
𝑦=𝑏0 + 𝑏1𝑥1 + 𝑏2𝑥2 + ... +𝑏𝑘 𝑥𝑘
where y is the dependent variable,
𝑥1,𝑥2,...,𝑥𝑘 are independent variables
and 𝑏0, 𝑏1,...,𝑏𝑘 are coefficients.
* Purpose: Analyzing the relationship between one dependent variable and multiple independent variables.
* Interpretation: Understanding the contribution of each independent variable to the dependent variable.
> 2024/7/15
## Chapter 3: Sampling Designs
* Sampling Methods: Random sampling, systematic sampling, stratified sampling.
* Sample Size Determination: Factors affecting sample size, calculation methods.
* Field Implementation: Practical aspects of conducting sampling in forests.
#### 3-1 Introduction
* Overview: Introduction to different sampling designs and their importance in forest measurements.
* Objective: To understand various sampling methods and their applications.
#### 3-2 Sampling versus Complete Enumeration
* Sampling: Selecting a subset of the population to make inferences.
* Complete Enumeration: Measuring every element in the population.
* Advantages and Disadvantages: Cost, time, and feasibility considerations.
#### 3-3 The Sampling Frame
* Definition: The list or map that identifies all elements in the population.
* Importance: Ensures that every element has a chance of being included in the sample.
#### 3-4 Simple Random Sampling
* Method: Each element has an equal chance of being selected.
* Procedure: Using random numbers to select sample elements.
* Applications: Basic method for unbiased estimates.
#### 3-5 Sampling Intensity
* Definition: Proportion of the population included in the sample.
* Factors: Cost, variability, and precision requirements.
#### 3-6 Effect of Plot Size on Variability
* Plot Size: Larger plots generally reduce variability.
* Trade-offs: Balancing plot size with practical considerations like time and cost.
#### 3-7 Systematic Sampling
* Method: Selecting samples at regular intervals.
* Procedure: First element chosen randomly, subsequent elements at fixed intervals.
* Advantages: Simplicity and coverage of the entire population.
#### 3-8 Stratifying the Population
* Stratification: Dividing the population into homogeneous subgroups (strata).
* Purpose: To increase precision by reducing variability within strata.
#### 3-9 Proportional Allocation of Field Plots
* Method: Allocating samples to strata in proportion to their size.
* Benefits: Ensures representation of all strata.
#### 3-10 Optimum Allocation of Field Plots
* Method: Allocating samples to strata based on variability and cost.
* Objective: Minimizing variance for a given cost or maximizing precision for a given budget.
#### 3-11 Sample Size for Stratified Sampling
* Calculation: Determining the number of samples needed in each stratum.
* Factors: Stratum size, variability, and desired precision.
#### 3-12 Regression Estimation
* Method: Using regression analysis to improve estimate accuracy.
* Application: Relating auxiliary variables to the variable of interest.
#### 3-13 Comparison of Regression Estimation to Simple Random Sampling
* Benefits: Generally provides more precise estimates than simple random sampling.
* Limitations: Requires a strong relationship between the variables.
#### 3-14 Ratio Estimation
* Method: Using the ratio of two correlated variables to improve estimates.
* Application: Common when measuring quantities that are proportional.
#### 3-15 Double Sampling with Regression and Ratio Estimation
* Double Sampling: Two-phase sampling where initial samples guide subsequent sampling.
* Regression and Ratio Estimation: Techniques used in the second phase for more accurate estimates.
#### 3-16 Double Sampling for Stratification
* Method: Initial samples used to stratify the population before detailed sampling.
* Benefits: Improves precision by ensuring proper stratification.
#### 3-17 Cluster Sampling
* Definition: Sampling groups (clusters) rather than individual elements.
* Applications: Useful when a population is naturally grouped.
#### 3-18 Two-Stage Sampling
* Method: Sampling in two stages, typically involving clusters in the first stage and individual elements in the second.
* Advantages: Efficient for large, spread-out populations.
#### 3-19 Simple Random Sampling for Attributes
* Application: Used when measuring categorical variables (attributes).
* Procedure: Same as simple random sampling but focused on attribute data.
#### 3-20 Cluster Sampling for Attributes
* Method: Similar to cluster sampling but used for categorical data.
* Benefits: Practical for large populations with distinct clusters.
#### 3-21 Relative Efficiencies of Sampling Plans
* Comparison: Evaluating different sampling methods based on efficiency.
* Factors: Precision, cost, and practical considerations.
## Chapter 4: Land Measurements
* Area Measurement: Methods for measuring forest area, including GPS and traditional techniques.
* Boundary Surveys: Establishing and verifying property boundaries.
* Topographic Surveys: Measuring elevation and terrain features.
#### 4-1 Application of Surveying
* Purpose: Surveying is fundamental in forest management for mapping, planning, and land division. It ensures accurate data for resource allocation, boundary determination, and legal documentation.
* Relevance: Precision in land measurements affects management decisions, legal disputes, and environmental assessments.
* Accurate surveys support sustainable practices and compliance with regulations.
### Measuring Distances
#### 4-2 Pacing Horizontal Distances
* Technique: Walking a known distance and counting steps to estimate other distances.
* Calibration: Determining step length over a known distance, typically done on flat, even terrain. Factors like stride length and walking speed can affect accuracy.
* Use Cases: Quick, rough estimates when high precision is not critical.
### 4-3 Chaining Horizontal Distances
* Tools: Chains (usually 100 feet or 66 feet) or steel tapes.
* Procedure: Proper alignment and tension are critical. Two-person teams often used, with one person anchoring the tape and the other pulling it taut.
* Maintenance: Regularly checking for kinks or bends in chains/tapes to maintain accuracy.
#### 4-4 Methods of Tape Graduation
* Graduations: Metric units (centimeters, meters) and imperial units (inches, feet).
* Usage: Ensuring that measurements adhere to standardized units for consistency and comparability across different surveys.
* Calibration: Regular checks against known distances to ensure accuracy.
#### 4-5 Electronic Distance Measurement
* Technology: Devices like Total Stations and laser rangefinders use electromagnetic waves.
* Advantages: Higher accuracy and efficiency compared to traditional methods. Can measure long distances quickly and accurately.
* Limitations: Require line-of-sight between measurement points and can be affected by atmospheric conditions.
### Using Magnetic Compass
#### 4-6 Nomenclature of the Compass
* Parts: Needle, rotating dial, baseplate, sighting mechanism, declination adjustment screw.
* Usage: Taking bearings, following azimuths, and navigating in the field. Proper understanding of each part is crucial for accurate readings.
#### 4-7 Magnetic Declination
* Definition: The angle difference between magnetic north (compass needle direction) and true north (geographic north pole).
* Importance: Essential for converting compass bearings to true bearings.
* Local Variation: Declination varies by geographic location and changes over time.
#### 4-8 Allowance for Declination
* Adjustment: Manually or with the compass’s built-in declination adjustment feature. Regular updates to declination values are necessary for accurate navigation.
#### 4-9 Use of the Compass
* Techniques: Taking bearings by sighting landmarks, using back bearings to verify location, and navigating along a set azimuth. Regular practice and calibration are important for accuracy.
### Area Determination
#### 4-10 Simple Closed Traverse
* Method: Connecting a series of straight survey lines to form a closed loop. Used for boundary surveys and area calculation.
* Procedure: Accurate angle and distance measurements at each traverse point. Ensuring the closure error (difference between start and end points) is minimal.
#### 4-11 Graphical Area Determination
* Techniques: Using scaled maps to draw and calculate areas. Common methods include plotting coordinates and measuring with tools like planimeters.
#### 4-12 Dot Grids
* Method: Overlaying a transparent grid of evenly spaced dots over a map and counting the dots within the area of interest.
* Calculation: Multiplying the number of dots by the area each dot represents.
#### 4-13 Planimeters
* Tool: A mechanical or digital device used to measure the area of irregular shapes on maps.
* Procedure: Tracing the perimeter of the shape to calculate the enclosed area.
#### 4-14 Transects
* Definition: Straight lines laid across a survey area to sample or measure specific attributes. Used for systematic sampling in ecological studies.
* Procedure: Measurements taken at regular intervals along the transect line.
#### 4-15 Topographic Maps
* Use: Representing terrain features and elevations with contour lines. Essential for understanding landscape features and planning surveys.
* Reading: Interpreting contour intervals and identifying key features like ridges, valleys, and slopes.
### Colonial Land Subdivision
#### 4-16 Metes and Bounds Surveys
* Description: Land boundaries described using physical features (metes) and compass directions (bounds).
* Application: Common in the original 13 colonies of the United States. Often used for irregularly shaped parcels.
### The U.S. Public Land Survey
#### 4-17 History
* Established in 1785 to systematically divide and distribute public lands.
#### 4-18 The Method of Subdivision
* Standardized system for dividing land into rectangular parcels (townships and sections).
#### 4-19 The 24-Mile Tracts
* Description: Large land tracts divided into smaller units for easier management and sale.
* Structure: Further subdivided into townships and sections.
#### 4-20 Townships
* Definition: 6-mile by 6-mile units within 24-mile tracts, each containing 36 sections.
* Numbering: Sequentially numbered to facilitate identification and location.
#### 4-21 Establishment of Sections and Lots
* Sections: 1-mile square units within townships, often divided into smaller lots.
* Lots: Smaller parcels within sections, used for sale and development.
#### 4-22 Survey Field Notes
* Content: Detailed records of measurements, observations, and conditions encountered during surveys.
* Importance: Essential for legal documentation and future reference.
#### 4-23 Marking Land Survey Lines
* Techniques: Using physical markers (e.g., stakes, blazes) and documentation for clear delineation.
* Maintenance: Regular checking and updating of markers to ensure they remain visible and accurate.
### Global Positioning Systems (GPS)
#### 4-24 Purpose of GPS
* Usage: Provides accurate location, mapping, and navigation in forestry and land management.
* Benefits: Enhances efficiency and accuracy in data collection and analysis.
#### 4-25 How GPS Works
* Principle: Triangulation from at least four satellites to determine precise positions on Earth.
* Components: Satellites, ground stations, and receivers.
#### 4-26 GPS Accuracy
Factors: Signal quality, atmospheric conditions, satellite geometry, and receiver quality.
Improvement: Techniques such as differential correction and WAAS (Wide Area Augmentation System).
#### 4-27 Differential Correction
* Method: Using a network of fixed ground-based reference stations to correct GPS signals and improve accuracy.
* Real-time and Post-processing: Two main types of differential correction.
#### 4-28 GPS Data
* Types: Coordinates (latitude, longitude), elevation, velocity, and time.
* Storage and Analysis: Data can be stored in GPS receivers and analyzed using GIS software.
#### 4-29 GPS Receivers
* Devics: Handheld units, smartphones, and specialized equipment for receiving and processing GPS signals.
* Features: Varying levels of accuracy, data storage, and processing capabilities.
## Chapter 5: Cubic Volume, Cord Measure, and Weight Scaling
* Volume Measurement: Techniques for measuring the volume of logs and trees.
* Cord Measurement: Definition and measurement of cords.
* Weight Scaling: Methods for estimating weight from volume and other measurements.
## Chapter 6: Log Rules, Scaling Practices, and Specialty Wood Products
* Log Rules: Various log rules (e.g., Doyle, Scribner) and their applications.
* Scaling Practices: Standard practices for log scaling.
* Specialty Products: Measurement techniques for specialty wood products.
## Chapter 7: Measuring Standing Trees
* Diameter Measurement: Tools and methods for measuring tree diameters.
* Height Measurement: Techniques for measuring tree height.
* Crown Measurement: Measuring crown dimensions and structure.
## Chapter 8: Volumes and Weights of Standing Trees
* Volume Estimation: Methods for estimating the volume of standing trees.
* Weight Estimation: Estimating the biomass and weight of trees.
* Allometric Equations: Use of equations to relate tree dimensions to volume and weight.
## Chapter 9: Forest Inventory
* Inventory Objectives: Purposes of conducting forest inventories.
* Data Collection: Types of data collected in forest inventories.
* Inventory Methods: Overview of different inventory methods.
## Chapter 10: Inventories with Sample Strips or Plots
* Sample Strips: Design and implementation of sample strips.
* Plot Sampling: Techniques for establishing and measuring plots.
* Data Analysis: Analyzing data collected from strips and plots.
## Chapter 11: Inventories with Point Samples
* Point Sampling: Principles and methods of point sampling.
* Basal Area Factor: Determining the basal area factor for sampling.
* Data Collection and Analysis: Collecting and analyzing point sample data.
## Chapter 12: Inventories with 3P Sampling
* 3P Sampling: Definition and principles of probability proportional to prediction (3P) sampling.
* Implementation: Steps for conducting 3P sampling.
* Advantages and Limitations: Pros and cons of 3P sampling.
## Chapter 13: Using Aerial Photographs
* Aerial Photography: Techniques for using aerial photographs in forest measurements.
* Photo Interpretation: Interpreting features from aerial photos.
* Applications: Uses of aerial photography in forest inventory and management.
## Chapter 14: Geographic Information Systems
* GIS Basics: Introduction to GIS and its components.
* GIS Applications: Using GIS for mapping, analysis, and forest management.
* Data Integration: Integrating various data sources into GIS.
## Chapter 15: Site Stocking and Stand Density
* Stocking Levels: Measuring and assessing site stocking levels.
* Stand Density: Methods for calculating stand density.
* Management Implications: Implications of stocking and density for forest management.
## Chapter 16: Tree Growth and Stand-Table Projection
* Tree Growth Measurement: Techniques for measuring tree growth over time.
* Growth Models: Using models to predict future growth.
* Stand-Table Projection: Projecting stand structure and composition.
## Chapter 17: Growth and Yield Methods
* Growth Measurement: Methods for measuring individual tree and stand growth.
* Yield Prediction: Predicting future yields from current measurements.
* Modeling Approaches: Different approaches to modeling growth and yield.
## Chapter 18: Assessing Rangeland Wildlife, Water, and Recreational Resources
* Rangeland Assessment: Techniques for assessing rangeland conditions and resources.
* Wildlife Monitoring: Methods for monitoring wildlife populations and habitats.
* Water Resources: Measuring and managing water resources in forested areas.
* Recreational Resources: Assessing and managing recreational use of forest lands.
 Sign in with Wallet
Connect another wallet
Sign in with Wallet
Connect another wallet