# MATH3856
## Exam sample
### Part A (QUIZ)
* Question 1
Which activation function in the output layer of a neural network would be most suited for a multiclass classification problem?
1. softmax
2. ReLu
3. Hyperbolic tangent
4. Linear
5. None of the above
Answer: A
:::info
在神經網絡的輸出層中,對於多類別分類問題,最適合的激活函數是 Softmax
* Softmax:這個函數可以將輸出值轉換為概率分佈,每個類別的概率之和為1。它特別適用於多類別分類問題,因為它可以表示模型對每個類別的預測概率。
* ReLU (Rectified Linear Unit):這是一個常用於隱藏層的激活函數,因為它有助於解決梯度消失的問題,並且計算上較為高效。然而,它不適用於輸出層,尤其是在處理分類問題時。
* Hyperbolic Tangent (tanh):這也是一個常見的激活函數,通常用於隱藏層。它的輸出範圍是(-1, 1),適合於需要考慮負值的場景,但不適用於多類別分類的輸出層。
* Linear:線性激活函數或無激活函數意味著輸出層的輸出是加權和。這通常用於回歸問題,而不是分類問題。
:::
* Question 2
which of the following statements is correct?
1. Adam is generallly faste than SGD
2. Achieving excellent training performance on the training dataset implies that yuo have excellent model.
3. it is best to randomly assign the number of hidden neurons irrespective of the dataset
4. Keras employs scikit-learn in its core framework
5. None of above
Answer: A
:::info
* Adam(Adaptive Moment Estimation)是一種基於一階梯度的優化算法,它通常比傳統的SGD更快,因為它結合了動量(momentum)和RMSprop的特點。Adam在調整學習率方面更加高效,這使得它在很多情況下比SGD收斂得更快。
* Achieving excellent training performance on the training dataset implies that you have an excellent model.
這不一定正確。如果一個模型在訓練數據集上表現得非常好,這可能意味著它過度擬合了訓練數據。一個真正優秀的模型應該在未見過的數據(測試集)上也能表現良好。
* It is best to randomly assign the number of hidden neurons irrespective of the dataset.
這是不正確的。隱藏神經元的數量應該根據特定的數據集和問題類型來決定。隨機分配可能導致模型的性能不佳,包括過擬合或欠擬合。
* Keras employs scikit-learn in its core framework.
這也是不正確的。Keras是一個獨立的深度學習框架,它可以與TensorFlow一起作為後端使用。雖然Keras可以與scikit-learn集成,但scikit-learn不是Keras的核心框架的一部分。
:::
* Question 3
What would be a major difference between the role of a data scientist and a data engineer?
1. They do not have any differences in roles at major companies
2. Data scientists typically use machine learning models to develop solutions and compile reports while data engineers work with databases/datasets to organize, process and visualize data.
3. Data engineers are database managers and data scientists are programmers.
4. They both do similar work, but data scientists present mostly while data engineers develop models.
5. None of the above.
Answer: B
:::info
數據科學家(Data Scientist):他們通常使用機器學習模型來開發解決方案,分析數據,並編寫報告。他們的工作側重於數據分析、建立預測模型、數據探索和提取洞見,以幫助決策過程。
數據工程師(Data Engineer):他們主要負責處理大規模數據集和數據庫,包括數據的收集、儲存、處理和整理。他們確保數據是可用的、一致的、安全的,並高效地支持分析和數據挖掘活動。
:::
* Question 4
What would be the best model for a highly non-linear and chaotic time series prediction problem?
1. Linear regression model
2. logistic regression model
3. Neural network model with sigmoid activation function in the output layer
4. Neural network model with linear activation function in the output layer
5. Either linear or sigmoid activation can be used in the output layer of a neural Network for this problem.
Answer: E
:::info
* Neural network model with sigmoid activation function in the output layer
具有非線性激活函數的神經網絡,非常適合處理非線性和複雜的數據模式。對於時間序列數據,深度學習模型(如循環神經網絡RNN或長短期記憶網絡LSTM)尤其有效,因為它們能夠捕捉到數據中的時間依賴性。
但輸出層使用Sigmoid激活函數可能不是最佳選擇
* Linear regression model
對於高度非線性和混沌的時間序列,線性回歸模型通常不足以捕捉數據的複雜性。
* Logistic regression model
邏輯回歸主要用於二元分類問題,而不是時間序列預測。
* Neural network model with linear activation function in the output layer
對於非線性問題,輸出層使用線性激活函數的神經網絡可能不足以提供良好的預測能力。
:::
* Question 5
Given Roc and AUC (0.7)in the below figure which of the following statements is true?
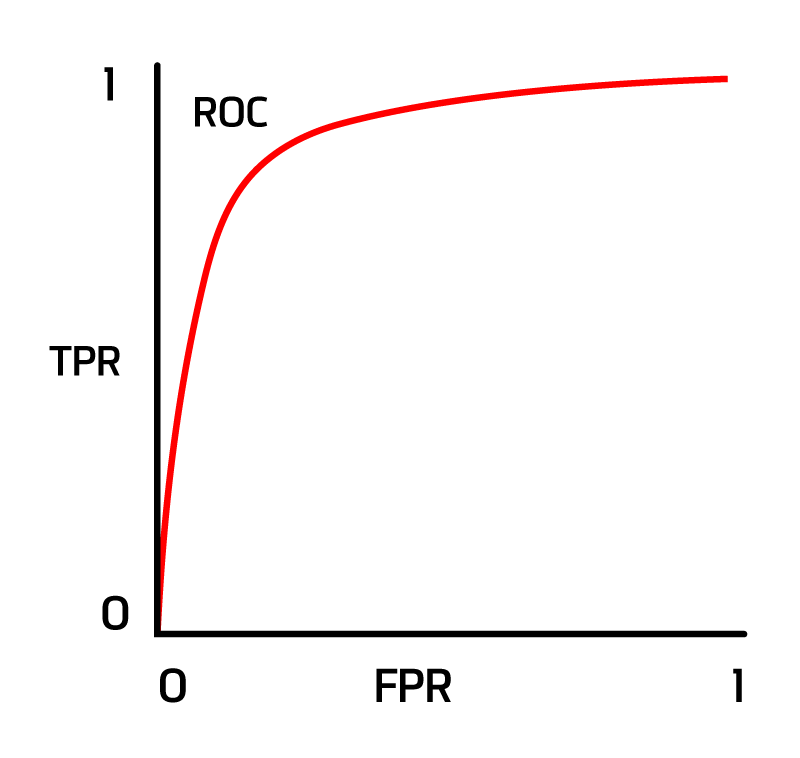
1. AUC of 0.7 implies a 70% chance that the model will distinguish between positive and negative classes.
2. The AUC shows that it is perfectly able to distinguish between positive and negative classes.
3. The AUC shows that the model is predicting a negative class as a positive and vice versa
4. None of the above
Answer: A
:::info
* AUC of 0.7 implies a 70% chance that the model will distinguish between positive and negative classes.
這個陳述是正確的。AUC值為0.7表示當隨機選擇一個正類樣本和一個負類樣本時,該模型將正類樣本的預測得分排在負類樣本之前的概率大約是70%。AUC值是ROC曲線下的面積,用於衡量分類器區分正類和負類的能力。AUC值範圍從0到1,值越高表示分類器的性能越好。
* The AUC shows that it is perfectly able to distinguish between positive and negative classes.
不正確。完美的分辨能力對應於AUC值為1。在這種情況下,AUC為0.7,表明模型具有一定的區分能力,但不是完美的。
* The AUC shows that the model is predicting a negative class as a positive and vice versa.
不正確。AUC值本身不提供有關模型將負類預測為正類或相反情況的具體信息。它只是衡量模型區分這兩個類別的總體能力。
:::
* Question 6
Assume you trained a decision tree model that offers very low training error, but very large test error. Select the most likely cause for this Problem?
1. Decision tree is overfitting
2. Decision tree is underfitting
3. There is too little training data
4. There is too little test data
Answer: A
:::info
* Decision tree is overfitting
當一個模型在訓練數據上表現得非常好,但在未見過的測試數據上表現不佳時,通常意味著模型過度擬合了訓練數據。在過度擬合的情況下,模型學習到了訓練數據中的噪聲和詳細特徵,而這些特徵並不具有普遍性,不能泛化到新的數據集上。決策樹尤其容易發生過度擬合,尤其是當樹的深度非常大時。
* Decision tree is underfitting
如果模型在訓練數據上的表現就很差,則可能是欠擬合問題。在這種情況下,模型太過簡單,無法捕捉數據的基本結構。
* There is too little training data
訓練數據太少可能會導致模型無法充分學習,但這通常會導致訓練錯誤和測試錯誤都較高。
* There is too little test data
雖然測試數據太少可能會導致對模型性能的評估不準確,但它不太可能是導致高測試錯誤的主要原因。
:::
* Question 7
Which one of the following statements is true?
1. In bagging models are trained sequentially, and the aim is to reduce errors in every subsequent step.
2. In boosting, models are trained in parallel independent of each other and the outcomes are combined.
3. In stacking, models are trained in parallel independent of each other and the outcomes are combined.
4. In bagging, models are trained independently of each other and the outcomes are combined.
5. None of the above.
Answer: D
:::info
* In bagging, models are trained independently of each other and the outcomes are combined.
Bagging(Bootstrap Aggregating)是一種集成學習技術,其中多個模型(通常是同類型的)獨立訓練,其預測結果被組合起來以形成最終的預測。這種方法通常用於減少模型的方差,例如隨機森林就是一個典型的bagging方法的應用。
* In bagging models are trained sequentially, and the aim is to reduce errors in every subsequent step.
這實際上描述的是boosting,而不是bagging。
* In boosting, models are trained in parallel independent of each other and the outcomes are combined.
這不正確。在boosting中,模型是依序訓練的,後一個模型會試圖糾正前一個模型的錯誤。
* In stacking, models are trained in parallel independent of each other and the outcomes are combined.
這部分正確。在堆疊(stacking)中,不同的模型獨立訓練,其預測結果被用作另一個模型(通常稱為元模型或堆疊器)的輸入,以形成最終預測。但是,這種描述並不完全涵蓋堆疊的所有方面。
:::
* Question 8
Suppose you want to cluster the following data set into two clusters. Which one of the following algorithms is the most suitable for your task?

1. K-Means Algorithm
2. DBSCAN Algorithm
3. Agglomerative Clustering Algorithm
4. Random Forest Algorithm
Answer: B
:::info
* DBSCAN Algorithm
DBSCAN(Density-Based Spatial Clustering of Applications with Noise)是一種基於密度的聚類算法。它能夠識別任何形狀的群集,並且對於具有噪聲的數據也很有效。從您提供的數據集中可以看出,數據點構成了兩個明顯的非線性群集,這種情況下DBSCAN會是一個很好的選擇。
* K-Means Algorithm
K-均值算法通常用於找到相對均勻和球形的群集。在這個特定的數據集中,由於群集的形狀是非線性的,K-均值可能無法有效地分割這些群集。
* Agglomerative Clustering Algorithm
聚合聚類是一種分層聚類算法,適用於各種形狀的群集,但對於確定群集數量有較大的不確定性,且可能不如DBSCAN在處理特定形狀的群集上有效。
* Random Forest Algorithm
隨機森林是一種監督學習算法,主要用於分類和回歸問題,而不是聚類。因此,它不適用於這個問題。
:::
* Question 9
Which one of the following sentences is correct?
1. Model-based collaborative filtering uses descriptions of items for recommendations and is similar to the Amazon-style recommender system.
2. Collaborative filtering works well even with very limited past recommendations.
3. memory-based collaborative filtering uses descriptions of items for recommendations, and is similar to Amazon-style recommender systems
4. model-based collaborative filtering uses well-understood techniques from information retrieval.
5. None of the above.
:::info
* Model-based collaborative filtering uses descriptions of items for recommendations and is similar to the Amazon-style recommender system.
不正確。模型基礎的協同過濾(model-based collaborative filtering)通常基於用戶的互動歷史(如評分或購買歷史),而不是基於物品的描述。類似於亞馬遜風格的推薦系統可能會使用基於內容的過濾(content-based filtering)或結合多種方法。
* Collaborative filtering works well even with very limited past recommendations.
不正確。協同過濾(collaborative filtering)依賴於充足的過去互動數據來生成有效的推薦。當過去的推薦數據非常有限時,這種方法的效果可能不佳,這種現象通常被稱為“冷啟動”問題。
* Memory-based collaborative filtering uses descriptions of items for recommendations, and is similar to Amazon-style recommender systems.
不正確。記憶基礎的協同過濾(memory-based collaborative filtering)通常基於用戶之間或物品之間的相似度,而不是基於物品的描述。它依賴於用戶的評分或互動歷史,而不是物品的內容特性。
* Model-based collaborative filtering uses well-understood techniques from information retrieval.
不正確。模型基礎的協同過濾使用的技術,如矩陣分解,並非直接源自信息檢索領域。雖然信息檢索的某些概念可能與推薦系統有關,但它們並不是模型基礎協同過濾的主要技術來源。
:::
:::success
如要根據“基於物品的描述”來進行推薦,通常會使用“基於內容的過濾”(Content-Based Filtering)技術。這種技術涉及分析和比較物品的特性(如文本描述、類別、標籤等)來推薦相似的物品。以下是一些基於內容的過濾方法:
文本分析和自然語言處理(NLP):用於處理和分析物品的文本描述,例如書籍的簡介、電影的劇情概要。這可以包括關鍵詞提取、主題建模(如LDA)和語義分析。
特徵提取:將物品的特性(如顏色、形狀、尺寸等)轉換為可用於比較的數字表示。在電影推薦系統中,這可能包括導演、演員、類型等特徵。
相似度計算:一旦物品的特徵被數字化,就可以使用各種相似度計算方法(如餘弦相似度、歐幾里得距離等)來找出相似的物品。
機器學習模型:可以訓練機器學習模型來學習用戶的偏好和物品的特徵之間的關係,從而進行個性化推薦。
:::
* Question 10
Which one of the following statements is not true about Principal Component Analysis(PCA)?
1. PCA is an unsupervised method.
2. PCA Searches for the directions that data have the smallest variance
3. MAcumum number of principal components <= number of features.
4. All principal components are orthogonal to each other.
Answer: B
:::info
PCA Searches for the directions that data have the smallest variance
不正確。實際上,PCA尋找的是數據具有最大方差的方向。主成分分析的目的是識別並保留最重要的特徵,這通常是指那些方差最大的特徵。它透過尋找數據維度中方差最大的方向,來減少數據的維度同時儘量保留原始數據的信息。
PCA is an unsupervised method.
正確。PCA是一種無監督學習方法,它不依賴於任何外部標籤或預測目標,而是僅僅基於數據集本身的特性。
Maximum number of principal components <= number of features.
正確。在PCA中,可得到的最大主成分數量等於原始特徵的數量,或者是樣本數量和特徵數量中較小的那個。
All principal components are orthogonal to each other.
正確。PCA中的每個主成分都是相互正交的,這意味著它們在數學上是互相獨立的,沒有相互重疊的信息。
:::
### Part B (short answer questions)
* Question 1
If a Decision Tree is overfitting the training set, is it a good idea to try decreasing "Max_depth"? Briefly explain ur answer.
:::success
如果一個決策樹對訓練集過度擬合,嘗試減少“Max_depth”(最大深度)是一個好主意。降低最大深度可以限制決策樹的成長,使其不會變得過於複雜。過度擬合通常發生在模型學習了訓練數據中的噪音和細節到不適用於新數據的程度。通過減少最大深度,可以提高模型的泛化能力,從而在未見過的數據上表現得更好。
:::spoiler
If a Decision Tree is overfitting the training set, trying to decrease "Max_depth" is indeed a good idea. Reducing the maximum depth can limit the growth of the decision tree and prevent it from becoming overly complex. Overfitting often occurs when a model learns the noise and details in the training data to an extent that it does not generalize well to new data. By decreasing the maximum depth, you can improve the model's generalization ability, thus performing better on unseen data.
:::
* Question 2
Briefly explain the most important difference between the AdaBoost and the Gradient Boosting methods.
:::info
AdaBoost(Adaptive Boosting)和梯度提升(Gradient Boosting)兩者最重要的區別在於它們各自調整訓練數據權重的方法。
AdaBoost通過增加之前被錯誤分類的數據點的權重來工作。在每一輪迭代中,模型更加關注那些之前被錯誤預測的數據點,試圖糾正這些錯誤。
相比之下,梯度提升不是直接調整數據點的權重,而是通過連續改進的方式來優化損失函數。每一輪迭代中,它會添加一個新的弱學習器來糾正前一輪留下的殘差(或錯誤),這是通過梯度下降算法來最小化整體模型的損失函數實現的。
:::spoiler
The most important difference between AdaBoost (Adaptive Boosting) and Gradient Boosting lies in their respective approaches to adjusting the weights of the training data.
AdaBoost works by increasing the weights of data points that were misclassified previously. In each iteration, the model focuses more on those data points that were incorrectly predicted before, attempting to correct these errors.
In contrast, Gradient Boosting does not directly adjust the weights of data points, but rather optimizes the loss function in a successive improvement manner. In each iteration, it adds a new weak learner to correct the residuals (or errors) left from the previous round, achieved through minimizing the overall model's loss function using gradient descent.
:::
* Question 3
Briefly describe two techniques to select the right number of clusters when using K-Means.
:::info
肘部方法(Elbow Method):這種方法涉及到多次運行K-均值算法,每次使用不同的K值,然後計算每次結果的總和方差(Within-Cluster Sum of Squares, WCSS)。隨著K值的增加,WCSS會減少,因為樣本會更接近其相應的群集中心。肘部方法的目標是找到WCSS迅速下降趨緩的點——這個點就像肘部一樣,通常被認為是一個好的群集數。
輪廓分數(Silhouette Score):輪廓分數是一種衡量群集緊密程度和分離程度的方法。它結合了群集內部緊密程度(群集內部數據點間的平均距離)和群集間的分離程度(不同群集的數據點間的平均距離)。輪廓分數範圍從-1到1,分數越高,群集質量越好。通過計算不同K值下的輪廓分數,可以選擇得分最高的K值。
:::spoiler
Elbow Method: This method involves running the K-Means algorithm multiple times with different values of K and calculating the total within-cluster sum of squares (WCSS) for each. As K increases, the WCSS decreases as samples will be closer to their respective cluster centroids. The goal of the elbow method is to find the point where the decrease in WCSS begins to slow down, resembling an "elbow". This point is often considered a good choice for the number of clusters.
Silhouette Score: The silhouette score is a measure of how similar an object is to its own cluster compared to other clusters. It combines the idea of cluster cohesion (how close the points within a cluster are) and separation (how distinct a cluster is from others). The silhouette score ranges from -1 to 1, with higher scores indicating better cluster quality. By calculating the silhouette score for different values of K, the value of K with the highest score can be chosen.
:::
* Question 4
In multi-layer perceptron, does increasing the number of hidden layers improve performance? Explain your answer with refernce to any dataset example from lessoons or assignment.
:::info
在多層感知器(Multi-Layer Perceptron, MLP)中,增加隱藏層的數量可以提高性能,但這並非總是如此。性能的改善依賴於多個因素,包括數據集的複雜性、模型的訓練和正則化方法。以下是對此問題的進一步解釋:
複雜數據集:對於複雜的數據集,比如圖像識別或語音識別問題,增加隱藏層可以幫助模型學習更複雜的特徵表示。例如,在深度學習中,卷積神經網絡(CNN)通過多個隱藏層有效地處理圖像數據。
簡單數據集:對於較為簡單的數據集,如基於簡單規則的分類問題,增加太多的隱藏層可能會導致過擬合。在這種情況下,一個較淺的網絡(即較少的隱藏層)可能就足夠了。
過擬合風險:增加隱藏層會增加模型的參數數量,這可能導致過擬合,尤其是當訓練數據有限時。這種情況下,需要適當的正則化技術,如dropout或權重衰減,來防止過擬合。
訓練挑戰:更深的網絡需要更仔細的設計和訓練,可能包括更複雜的優化算法和更精確的參數初始化策略。
總的來說,是否增加隱藏層以及增加多少層,應該基於特定問題和數據集的需求來決定。對於某些問題,增加隱藏層可以提高性能,但對於其他問題,過多的隱藏層可能會帶來過擬合和訓練困難。
:::spoiler
In a Multi-Layer Perceptron (MLP), increasing the number of hidden layers can improve performance, but this is not always the case. The improvement depends on several factors, including the complexity of the dataset, training methods, and regularization techniques. Here is a more detailed explanation:
Complex Datasets: For complex datasets, such as in image or speech recognition tasks, increasing hidden layers can help the model learn more complex feature representations. For instance, in deep learning, Convolutional Neural Networks (CNNs) effectively process image data through multiple hidden layers.
Simple Datasets: For simpler datasets, like classification problems based on simple rules, adding too many hidden layers might lead to overfitting. In these cases, a shallower network (i.e., fewer hidden layers) might suffice.
Risk of Overfitting: Adding more hidden layers increases the number of parameters in the model, which can lead to overfitting, especially when the training data is limited. Regularization techniques, such as dropout or weight decay, are needed to prevent overfitting in such cases.
Training Challenges: Deeper networks require more careful design and training, possibly including more complex optimization algorithms and more precise parameter initialization strategies.
Overall, the decision to increase hidden layers and by how much should be based on the specific needs of the problem and dataset. For some problems, adding hidden layers can enhance performance, but for others, too many layers might bring overfitting and training difficulties.
:::
* Question 5
Explain what is happening in the code below
```
def BackwardPass(self, input_vec, desired):
out_delta = (desired - self.out)*(self.out*(1-self.out))
hid_delta = out_delta.dot(self.W2.T) * (self.hidout * (1-self.hidout))
if self.vanilla == True:
self.W2+= self.hidout.T.dot(out_delta) * self.learn_rate
self.B2+= (-1 * self.learn_rate * out_delta)
self.W1 += (input_vec.T.dot(hid_delta) * self.learn_rate)
self.B1+= (-1 * self.learn_rate * hid_delta)
else:
v2 = self.W2.copy()
v1 = self.W1.copy()
b2 = self.B2.copy()
b1 = self.B1.copy()
self.W2+= ( v2 *self.momenRate) + (self.hidout.T.dot(out_delta) * self.learn_rate) # velocity update
self.W1 += ( v1 *self.momenRate) + (input_vec.T.dot(hid_delta) * self.learn_rate)
self.B2+= ( b2 *self.momenRate) + (-1 * self.learn_rate * out_delta) # velocity update
self.B1 += ( b1 *self.momenRate) + (-1 * self.learn_rate * hid_delta)
```
:::info
該代碼段是一個神經網絡中的向後傳播(Backward Pass)函數,用於根據網絡的預測誤差更新權重和偏差。以下是代碼的步驟分析:
計算輸出層和隱藏層的誤差:
out_delta:這是輸出層誤差的計算。它基於目標輸出(desired)和實際輸出(self.out)之間的差異,並乘以輸出單元的導數(假設使用的是sigmoid激活函數,所以導數是self.out * (1 - self.out))。
hid_delta:這是隱藏層的誤差。它由輸出層的誤差(out_delta)通過權重(self.W2)向後傳播,並對隱藏層輸出(self.hidout)應用導數。
權重和偏差的更新:
如果self.vanilla為True,則使用標準的梯度下降法更新權重(self.W1,self.W2)和偏差(self.B1,self.B2)。更新是基於誤差和學習率(self.learn_rate)。
如果self.vanilla為False,則使用具有動量(momentum)的梯度下降法。這裡,權重和偏差的更新不僅依賴於當前的梯度,還依賴於前一次更新的權重和偏差(v2,v1,b2,b1),以及動量率(self.momenRate)。這有助於加速學習並穩定收斂過程。
總之,這個函數的目的是根據神經網絡的誤差來調整其權重和偏差,這是神經網絡訓練過程中的關鍵部分。此代碼提供了兩種權重更新方法:一種是標準梯度下降法,另一種是帶有動量的梯度下降法。
:::spoiler
The code segment is a Backward Pass function in a neural network, used to update the weights and biases based on the network's prediction error. Here is an analysis of the steps in the code:
Calculating Errors for Output and Hidden Layers:
out_delta: This is the calculation of the error for the output layer. It is based on the difference between the desired output (desired) and the actual output (self.out), multiplied by the derivative of the output unit (assuming a sigmoid activation function is used, so the derivative is self.out * (1 - self.out)).
hid_delta: This is the error for the hidden layer. It is calculated by backpropagating the output layer's error (out_delta) through the weights (self.W2) and applying the derivative to the hidden layer's output (self.hidout).
Updating Weights and Biases:
If self.vanilla is True, it updates the weights (self.W1, self.W2) and biases (self.B1, self.B2) using standard gradient descent. The update is based on the error and the learning rate (self.learn_rate).
If self.vanilla is False, it uses gradient descent with momentum. Here, the updates of weights and biases depend not only on the current gradient but also on the weights and biases from the previous update (v2, v1, b2, b1), as well as the momentum rate (self.momenRate). This helps to accelerate learning and stabilize the convergence process.
In summary, this function aims to adjust the weights and biases of the neural network based on its error, which is a key part of the training process in neural networks. The code provides two methods of weight updating: one using standard gradient descent and the other using gradient descent with momentum.
:::
* Question 6
What are the major similarities and differences between Adam and AdaGrad? If given a regression or Classification problem, which one would perform better and why? How would you evaluate them?
:::info
Adam(Adaptive Moment Estimation)和AdaGrad(Adaptive Gradient Algorithm)是兩種流行的優化算法,用於訓練深度學習模型。它們的主要相似點和不同點如下:
相似點:
自適應學習率:Adam和AdaGrad都是自適應學習率優化算法。這意味著它們可以根據每個參數的梯度自動調整學習率,有助於提高訓練的穩定性和效率。
適用於非凸優化:這兩種算法都適合於非凸優化問題,這在深度學習模型中非常常見。
不同點:
一階和二階動量:Adam結合了一階動量(類似於梯度下降中的動量項)和二階動量(類似於AdaGrad和RMSprop中的均方根項)。這使得Adam在很多情況下表現更為穩健。
調整梯度累積方式:AdaGrad會對所有過去梯度的平方進行累加,從而調整學習率。這可能導致後期學習率過小,進而導致提前停止學習。相比之下,Adam通過計算梯度的指數移動平均來解決這個問題,從而避免了學習率降低得過快。
在回歸或分類問題中的表現:
選擇哪一種算法取決於具體問題和數據集。一般來說,Adam因其穩定性和快速收斂性,在許多實際應用中表現更佳,特別是在大規模數據集和複雜的深度學習模型上。
AdaGrad對於稀疏數據集可能表現較好,但由於學習率單調遞減的特性,它可能在訓練的後期階段表現不佳。
評估方法:
評估這些算法的一種方法是進行交叉驗證,比較不同算法在相同數據集上的性能,包括損失函數值、準確率、收斂速度等指標。
另外,實驗中應該注意超參數的調整,因為不同的設置可能對算法的表現有顯著影響。
總的來說,選擇適當的優化算法需要根據具體問題進行實驗和評估。在多數情況下,Adam由於其平衡的特性,可能是一個更好的首選。
:::spoiler
Adam (Adaptive Moment Estimation) and AdaGrad (Adaptive Gradient Algorithm) are two popular optimization algorithms used in training deep learning models. Their major similarities and differences are as follows:
Similarities:
Adaptive Learning Rates: Both Adam and AdaGrad are adaptive learning rate optimization algorithms. This means they can automatically adjust the learning rate for each parameter based on its gradients, which helps in stabilizing and making the training process more efficient.
Suitable for Non-Convex Optimization: Both algorithms are suitable for non-convex optimization problems, which are very common in deep learning models.
Differences:
First and Second Moment Estimation: Adam combines the first moment (akin to the momentum term in gradient descent) and the second moment (similar to the root mean square term in AdaGrad and RMSprop). This makes Adam more robust in many scenarios.
Adjustment of Gradient Accumulation: AdaGrad accumulates all past gradients' squares, adjusting the learning rate accordingly. This can lead to a diminishing learning rate too quickly, potentially stopping learning prematurely. Adam addresses this issue by computing exponential moving averages of the gradients, thus avoiding too rapid a decrease in learning rate.
Performance in Regression or Classification Problems:
The choice of which algorithm to use depends on the specific problem and dataset. Generally, Adam, due to its stability and fast convergence, performs better in many practical applications, especially on large datasets and complex deep learning models.
AdaGrad may perform well on sparse datasets but might underperform in later stages of training due to its monotonically decreasing learning rate.
Evaluation Methods:
One way to evaluate these algorithms is through cross-validation, comparing the performance of different algorithms on the same dataset, including metrics like loss function value, accuracy, and speed of convergence.
Also, careful tuning of hyperparameters should be noted in experiments, as different settings can significantly impact the performance of algorithms.
In summary, choosing the appropriate optimization algorithm requires experimentation and evaluation based on the specific problem. In most cases, Adam, due to its balanced nature, might be a better first choice.
:::
## Cheat Sheets
Cheat Sheets and open sites
Cheat sheets
Pandas
Source: Pandas. (n.d). Data Wrangling with Pandas Cheat Sheet. Retrieved from https://pandas.pydata.org/Pandas_Cheat_Sheet.pdf
Numpy
Source: DataCamp. (2017, January 17). NumPy Cheat Sheet: Data Analysis in Python. Retrieved from https://s3.amazonaws.com/assets.datacamp.com/blog_assets/Numpy_Python_Cheat_Sheet.pdf
Scikit-learn
Source: DataCamp. (2017, January 7). Scikit-Learn Cheat Sheet: Python Machine Learning. Retrieved from https://s3.amazonaws.com/assets.datacamp.com/blog_assets/Scikit_Learn_Cheat_Sheet_Python.pdf
Keras
Source: DataCamp. (2017, April 16). Keras Cheat Sheet: Neural Networks in Python. Retrieved from https://s3.amazonaws.com/assets.datacamp.com/blog_assets/Keras_Cheat_Sheet_Python.pdf
Matplotlib
Source: DataCamp. (2019, October 2). Matplotlib Cheat Sheet: Plotting in Python. Retrieved from https://s3.amazonaws.com/assets.datacamp.com/blog_assets/Python_Matplotlib_Cheat_Sheet.pdf
ggplot- Data Visualisation
RStudio. (n.d.). Data Visualization with ggplot2. Retrieved from https://rstudio.com/wp-content/uploads/2015/03/ggplot2-cheatsheet.pdf
Keras
RStudio. (n.d). Kera. Retrieved from https://raw.githubusercontent.com/rstudio/cheatsheets/master/keras.pdf
Data Transformation
RStudio. (n.d). Data transformation. Retrieved from https://raw.githubusercontent.com/rstudio/cheatsheets/master/data-transformation.pdf
Caret
RStudio. (n.d). Caret. Retrieved from https://raw.githubusercontent.com/rstudio/cheatsheets/master/caret.pdf
ML modelling
RStudio. (n.d). Machine learning modelling. Retrieved from https://raw.githubusercontent.com/rstudio/cheatsheets/master/Machine%20Learning%20Modelling%20in%20R.pdf
User guides
NumPy. (2020, 23 March). NumPy user guide. Retrieved from https://numpy.org/doc/1.18/numpy-user.pdf
CRAN. (2020, 20 March). caret Package. Retrieved from https://cran.r-project.org/web/packages/caret/caret.pdf
Riptutorial. (n.d.). Matplotlib. Retrieved from https://riptutorial.com/Download/matplotlib.pdf
CRAN. (n.d.). KerasR. Retrieved from https://cran.r-project.org/web/packages/keras/keras.pdf
Scikit-learn. (2020, 04 August). Scikit-learn guide. Retrieved from https://scikit-learn.org/stable/_downloads/scikit-learn-docs.pdf
ML resources
Scikit-learn. (n.d.). Machine Learning in Python. Retrieved from https://scikit-learn.org/stable/
Keras. (n.d.). R interface to Keras. Retrieved from https://keras.rstudio.com/
Keras. (n.d.). Introduction to Keras. Retrieved from https://keras.io/
Max Kuhn (2019, 27 March). The caret Package. Retrieved from https://topepo.github.io/caret/
Max Kuhn. (2013). Predictive modeling with R and Caret package. Retrieved from https://www.r-project.org/conferences/useR-2013/Tutorials/kuhn/user_caret_2up.pdf
Basic Python and R documentation
Python. (n.d.). Python 3.9.0 documentation. Retrieved from https://docs.python.org/3/.
Python bug tracker. (2018, 02 September). Python tutorial. Retrieved from https://bugs.python.org/file47781/Tutorial_EDIT.pdf
Rdrr.io. (n.d). All R language documentation. Retrieved from https://rdrr.io/r/
E. Paradis. (2005, 12 September). R for beginners. Retrieved from https://cran.r-project.org/doc/contrib/Paradis-rdebuts_en.pdf
CRAN. (2020, 22 June). An introduction to R. Retrieved from https://cran.r-project.org/doc/manuals/r-release/R-intro.pdf
CRAN. (2019, 12 April). An introduction to R. Retrieved from https://cran.r-project.org/web/packages/rpart/rpart.pdf
Update 14th October
We will remove Scikit-learn cheat sheet since it is refereeing to previous session.Students can use the documentation in the website Scikit-learn which will be available
 Sign in with Wallet
Connect another wallet
Sign in with Wallet
Connect another wallet